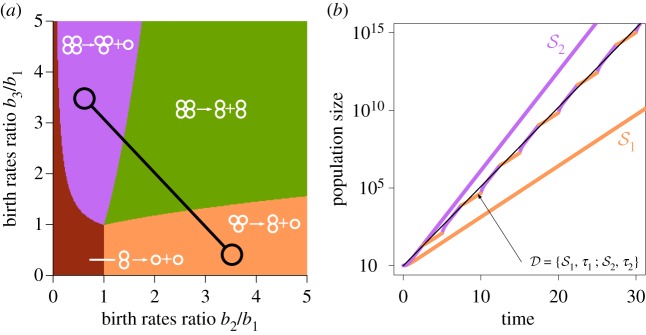
Figure 2.
Unconstrained population growth in a dynamic environment can be approximated by exponential growth. (a) The map of evolutionarily optimal life cycles in static environments. Only four pure binary life cycles are evolutionarily optimal: 1 + 1, 2 + 1, 3 + 1 or 2 + 2. The dynamic environment with seasons and is represented by a pair of interconnected circles. (b) The growth of population executing a pure life cycle 3 + 1 (q3 + 1 = (0; 0, 0; 1, 0, 0, 0)) in dynamic and static environments. Each line shows the temporal growth of the population size. Coloured lines correspond to the population growth in static environments and , respectively. The two-coloured line indicates the population growth in the dynamic environment, alternating between two seasons and with τ1 = τ2 = 2.5. While the growth in the dynamic environment is complicated in general, it can be approximated very well by exponential growth (thin black line). (Online version in colour.)

