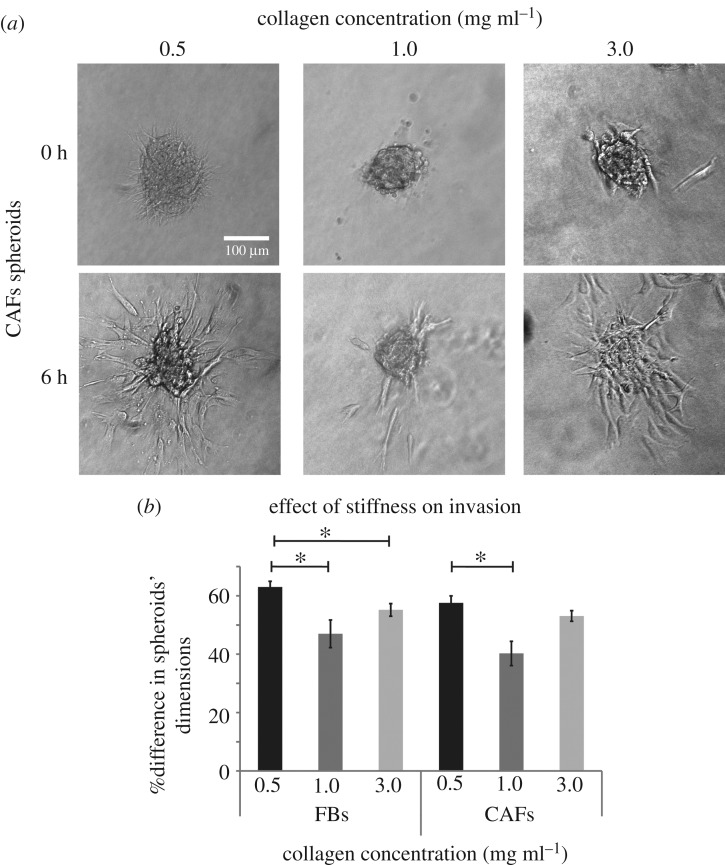
Figure 6.
Effect of collagen stiffness on FBs and CAFs invasion and expression of RhoA and ROCK in the absence or presence of TGF-β. (a) Representative CAFs spheroids embedded in collagen gels at time 0 and at 6 h post implantation, respectively. (b) Percentage (%) change in FBs and CAFs spheroids' dimensions within 6 h post-implantation. Asterisks indicate a statistically significant difference between compared groups (p < 0.05).

