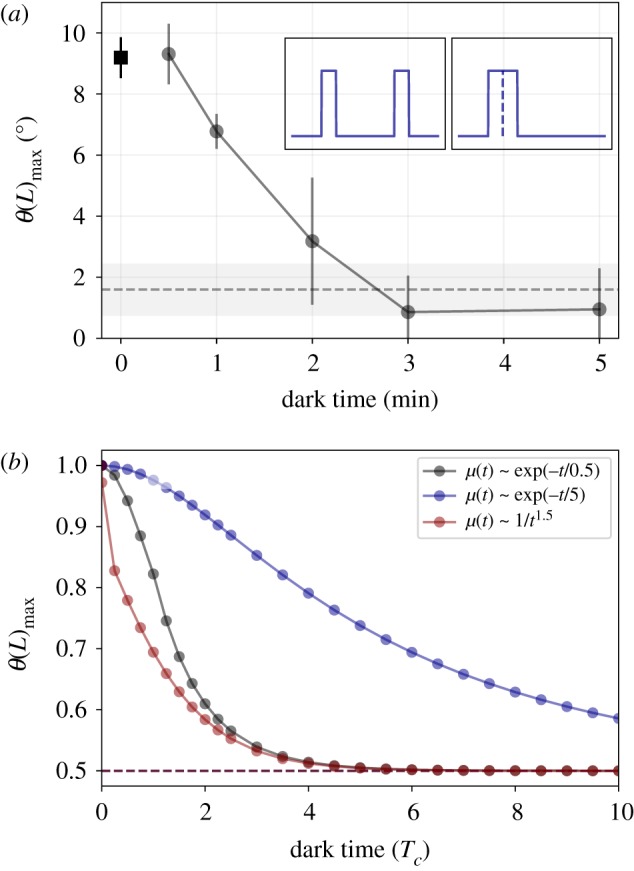
Figure 3.

(a) Summation experiment on the phototropic response of Vaucheria geminata, adapted from Kataoka [11]. Inset shows lighting protocols in arbitrary units; two pulses of light separated by dark time, versus a single continuous pulse with double the duration. Circles are the average maximal tip angle (vertical bars indicate SE) measured for the response to two light pulses, each 10 s and 6 W m−2, separated by a dark interval of various durations (x-axis). The square symbol is the response to a continuous pulse of 20 s (zero lag). The vertical dashed line is the average response to a single pulse of 10 s, where the grey bar indicates the SE. (b) Equivalent simulations of summation experiment with two pulses of duration 0.0025 Tc, using different response functions: two exponentials μ(t) ∼ exp(− t/τ) with τ = 5Tc (blue, top line) and τ = 0.5Tc (black, middle line), and a power law μ(t) ∼ 1/t1.5 (red, bottom line). Maximal tip angles are normalized to allow comparison, so that the maximal angle for zero lag is always 1, and the control response to a single pulse is 0.5 (dashed line). (Online version in colour.)
