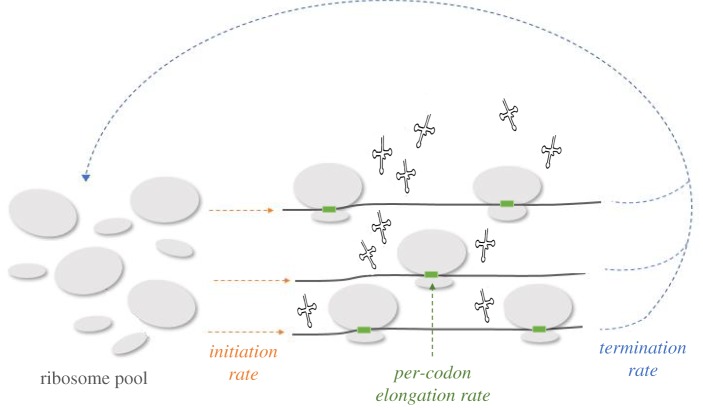
Figure 2.
A general schematic plot of the competition model of mRNA and ribosomes: the model includes all mRNAs in the cell such that each mRNA (in black) has a specific initiation rate (in orange). Each codon on the mRNA has a specific elongation rate (in green). In addition, the model in the illustration includes all ribosomes in the cell (in grey) which are divided into two groups: the free ribosomes and the occupied ribosomes (i.e. ribosomes that are actively translating the mRNAs). Ribosomes move along the mRNA based on the TASEP rules (described in the main text) and the pool status is dynamically changed accordingly. Specifically, ribosomes that complete the translation of an mRNA are added to the free pool of ribosomes (termination rates are in blue), and ribosomes that begin translating an mRNA are subtracted from the free pool of ribosomes (initiation rates are in orange). (Online version in colour.)

