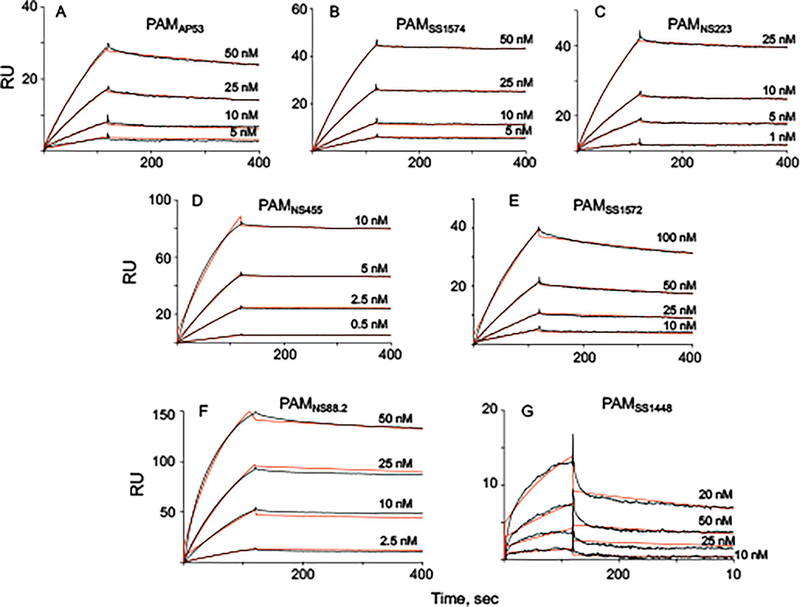
Fig. 6.
Binding assays of full-length r-PAMs to hPg. All binding experiments were conducted by SPR at 25° C. Kinetic analyses were performed for (A) PAMAP53, (B) PAMSS1574, (C) PAMNS223, (D) PAMNS455, (E) PAMss1572, (F) PAMns88.2, (G) PAMss1448. The data were fit using a 1:1 Langmuir binding model. The corresponding binding constants (KD) for these curves were calculated from the average values of koff/kon, are provided in Table 3.

