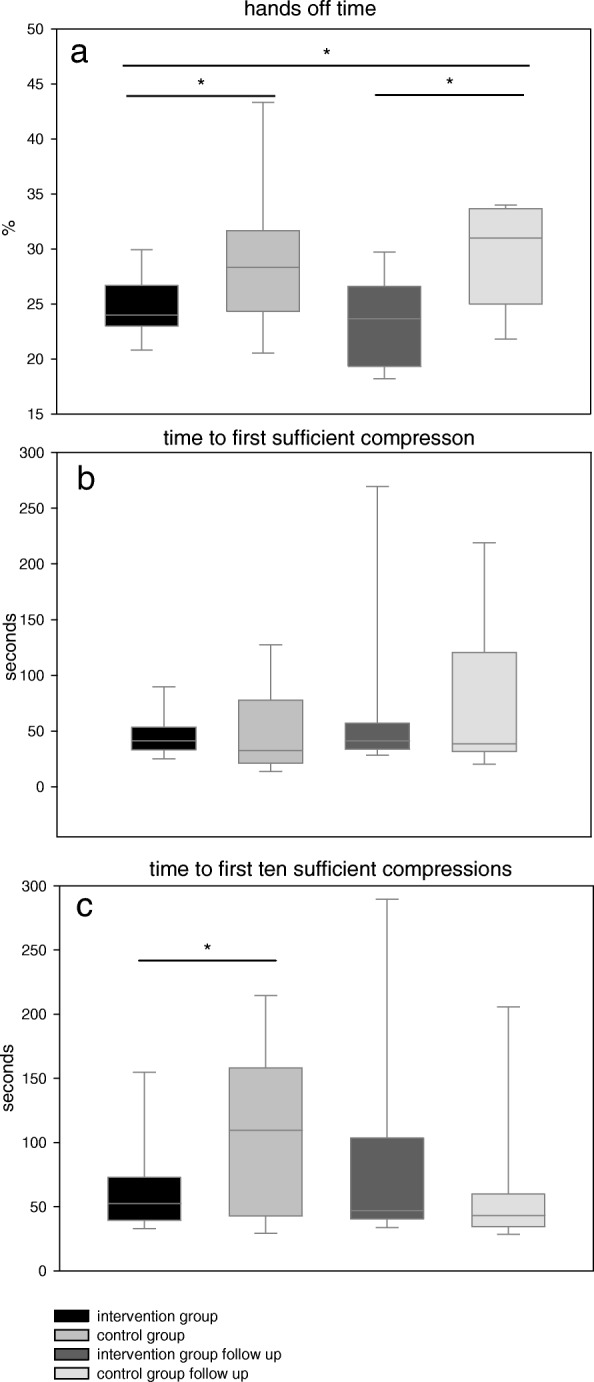
Fig. 2.

Compression quality. a Percentage of hands off time during treatment (intervention group 24.0(23.0/26.7)%, control group 28.3(24.3/31.7)%;Follow-up: intervention group 23.7(19.3/26.6)%, control group 31.0(25.0/33.7)%) b Time from beginning to first sufficient compression (intervention group 41.2(33.0/53.5)sec., control group 32.6(21.4/77.7)sec.; Follow-up: intervention group 41.2(33.8/57.0)sec., control group 38.4(31.6/120.7)sec.) c Time from beginning to first ten sufficient compressions in a row (intervention group 52.3(39.3/72.8)sec., control group 109.6(42.6/158.2)sec.; Follow-up: intervention group 46.9(40.6/103.5)sec., control group 43.0(34.5/59.8)sec.); (* = p < 0.05)
