Fig. 3.
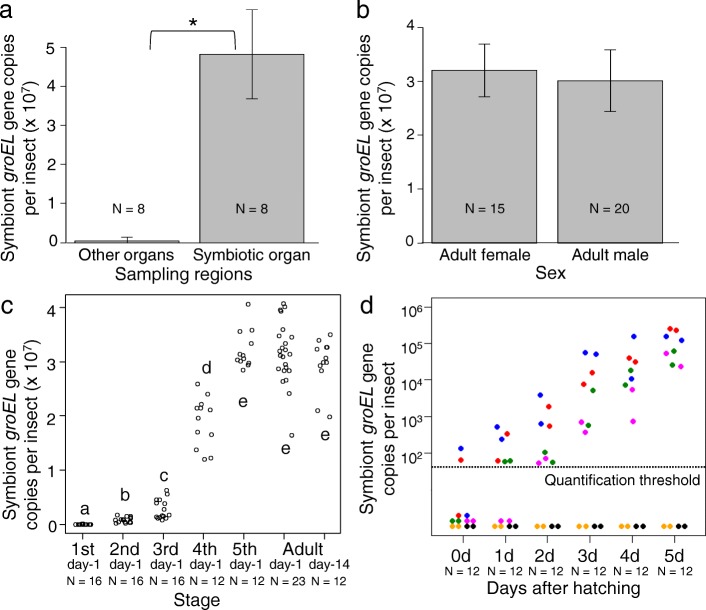
Population dynamics of the symbiotic bacteria in the developmental course of P. stali. Symbiont titers were evaluated in terms of symbiont groEL gene copies using qPCR. a Comparison of the symbiont titers between the midgut symbiotic organ (M4) and the other regions (M1, M2, M3, M4b and hindgut) of the alimentary tract. Columns and bars show means and standard deviations. Asterisk indicates statistically significant difference (Mann-Whitney U-test; P < 0.01). b Comparison of the symbiont titers between adult females and adult males. Columns and bars show means and standard deviations. The difference is statistically not significant (Man-Whitney U-test; P = 0.309). c Population dynamics of the symbiotic bacteria in the developmental course of P. stali. Each dot shows the symbiont titer in an insect. Different alphabetical letters (a-e) indicate statistically significant differences (Steel-Dwass test; P < 0.01). Abbreviations: 1st day-1, first instar nymphs 1 day after hatching; 2nd day-1, second instar nymphs 1 day after molting; 3rd day-1, third instar nymphs 1 day after molting; 4th day-1fourth instar nymphs 1 day after molting; 5th day-1, fifth instar nymphs 1 day after molting; Adult day-1, adults 1 day after eclosion; Adult day-14, adults 2 weeks after eclosion. d Population dynamics of the symbiotic bacteria in newborn nymphs of P. stali. Each dot shows the symbiont titer in an insect and each color indicates the insects derived from the same egg mass. Quantification threshold value of qPCR was set at 50 groEL gene copies per insect. Abbreviations: 0d, first instar nymphs on the day of hatching; 1d, first instar nymphs 1 day after hatching; 2d, first instar nymphs 2 days after hatching; 3d, first instar nymphs 3 days after hatching; 4d, second instar nymphs 4 days after hatching or on the day of molting; 5d, second instar nymphs 5 days after hatching or 1 day after molting. Note that logarithmic growth of the symbiotic bacteria was observed in the insects derived from the egg masses shown in red, blue, green and magenta, whereas little population growth of the symbiotic bacteria was observed in the insects derived from the egg masses shown in black and orange

