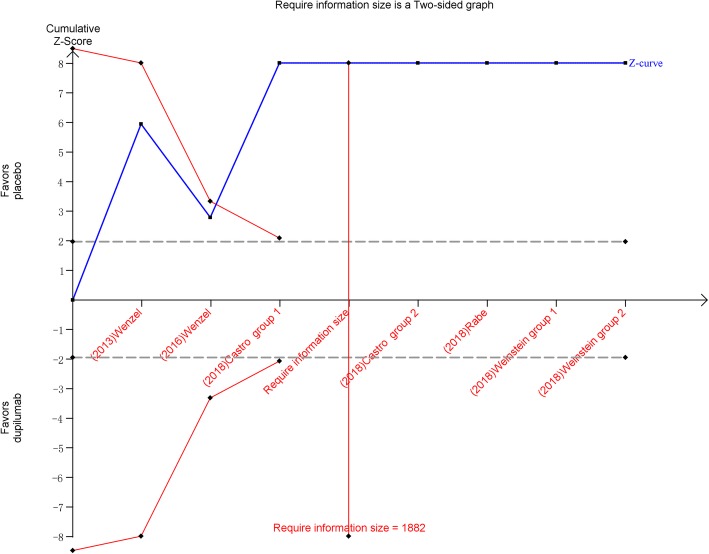
Fig. 2.
Trial sequential analysis of 5 trials comparing dupilumab with placebo for FEV1. Trial sequential analysis of 7 groups (two trial contains two groups) illustrating that the cumulative z curve crossed both the conventional boundary and the trial sequential monitoring boundary, establishing sufficient and conclusive evidence and suggesting that further trials are not required. Using α = 0.05 (two-sided) and β = 0.20 (power of 80%) calculate that the optimal sample size was 1882 patients

