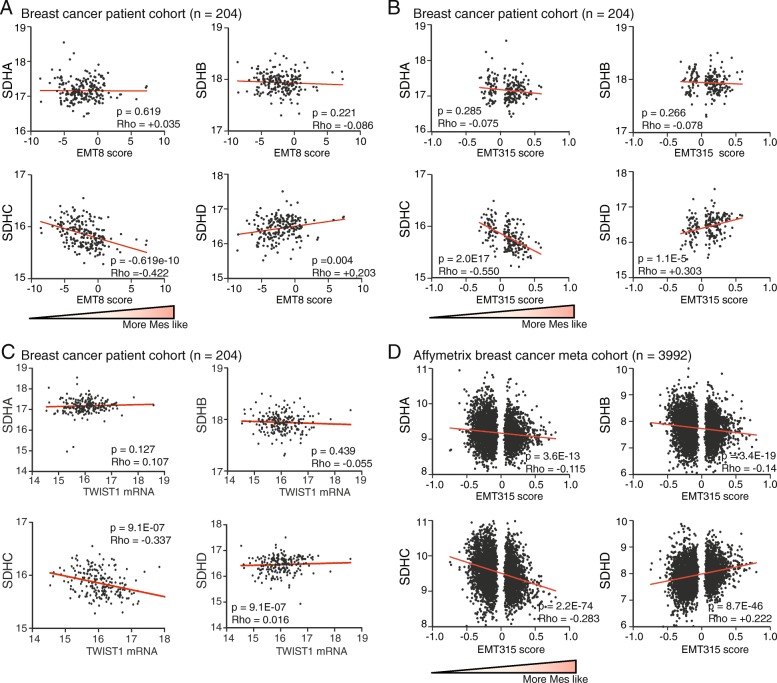
Fig. 1.
Association between SDH and EMT in gene expression data from breast cancer patient cohorts. Gene expression (mRNA) correlation analysis (Spearman) between SDH subunits and EMT signature in datasets from breast cancer patients. a Breast cancer patient cohort (n = 204), using the EMT8 signature (8 genes). b Breast cancer patient cohort (n = 204), using the EMT315 signature (315 genes). c Breast cancer patient cohort (n = 204), correlation with TWIST1 expression. d Affymetrix breast cancer patient meta cohort (n = 3992), relative to the EMT315 signature. The gene expression data are displayed with relative arbitrary units

