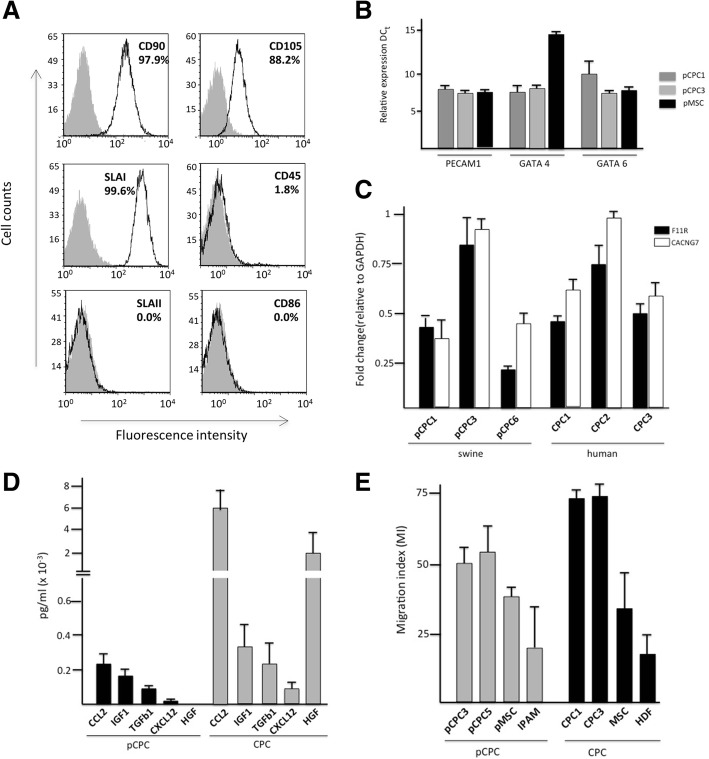
Fig. 2.
Phenotypic and functional characterization of pCPC. Comparison with hCPC. a Swine CPC characterization by flow cytometry. Expression of CD90, CD105, CD45, SLAI, SLAII, and CD86 is shown (empty histogram) and the number of positive cells is indicated (%). Gray-filled area represents isotype control. b RT-qPCR analysis of PECAM1 (CD31), GATA4, and GATA6 expression in the pCPC batches. Ct value for each sample/gene analyzed. There are no significant differences between the batches used. The average expression normalized to beta-2-microglobulin (β2M) is shown. Error bars represent SD (n = 3). c Comparative expression analysis of F11R and CACNG7 membrane makers, in both swine and human isolates; three independent isolates were compared for each cell type. The assay was performed three times, and data are expressed as mean ± SD; black lines indicate the p value summary (***< 0.002, **< 0.02, *< 0.05) (one-way analysis of variance followed by the Bonferroni multiple comparison test). d Porcine CPC (n = 4) secretome characterization by ELISA compared to human CPC (n = 3) secretome. The results are expressed as mean ± SD in pg/mL. e Migration assay. Conditioned medium (CM) of human cells (CPC1, CPC3, MSC, and HDF), were compared with CM obtained from swine samples (pCPC3 and pCPC5, pMSC and IPAM (pig alveolar macrophages) in their capacity to trigger the migration of MonMac-1 cells

