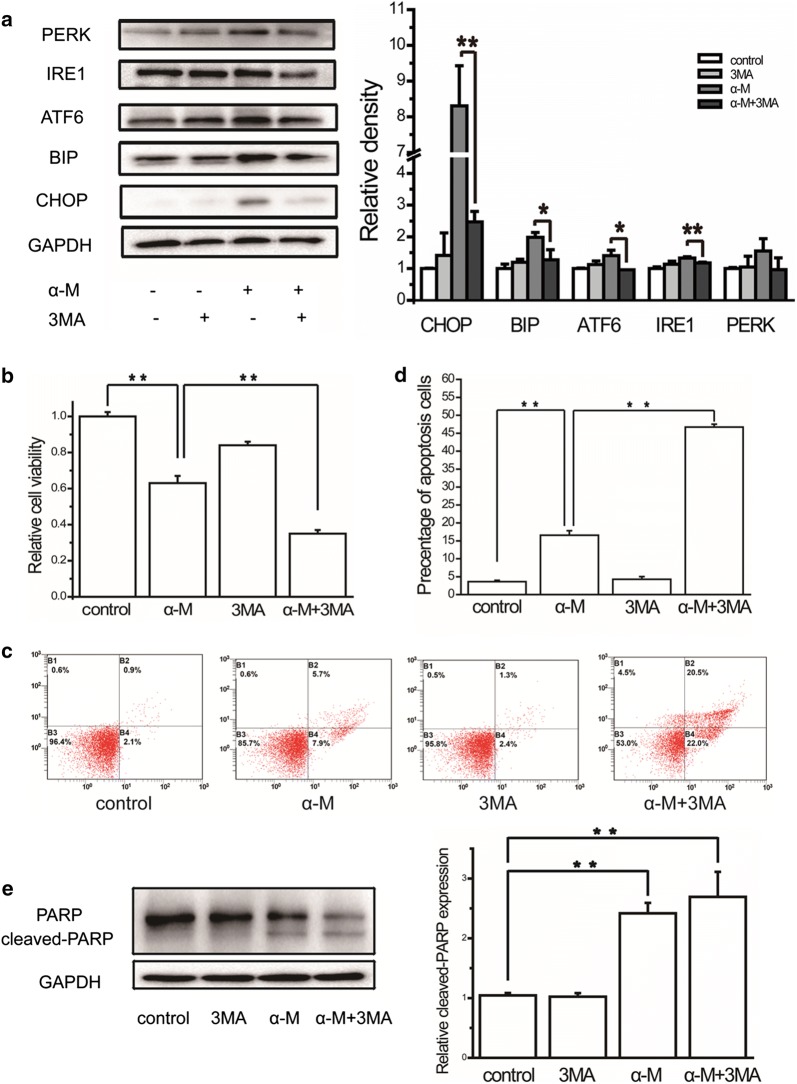
Fig. 3.
The effects of autophagy inhibitor on ER stress, cell viability and apoptosis. a The relative expression levels of CHOP, BIP, ATF6, IRE1 and PERK in cells treated with/without 4 μm α-mangostin followed 24 h incubation with/without 3MA were analyzed by western blot and quantified. Data represented the mean ± SD of three independent experiments. *p < 0.05, **p < 0.01. b Cells were treated with/without 4 μm α-mangostin followed 24 h incubation with/without 3MA. Cell viabilities were then determined by the CCK-8 assay. Data represented the mean ± SD of three independent experiments. *p < 0.05, **p < 0.01. c Cells were treated with/without 4 μm α-mangostin followed 24 h incubation with/without 3MA and double-stained with annexin V and PI and analyzed by flow cytometry. The gate setting distinguished between living (bottom left), necrotic (top left), early apoptotic (bottom right), and late apoptotic (top right) cells. d The percentage of apoptotic cells in each well was counted under flow cytometry. Data represented the mean ± SD of three independent experiments. *p < 0.05, **p < 0.01. e α-Mangostin and 3MA induced apoptosis in MDA-MB-231 cells as assessed by PARP cleavage. The expression levels of PARP and cleaved PARP were analyzed by western blot and were quantified densitometrically with the software ImageJ and calculated according to the reference bands of GAPDH. Data represented the mean ± SD of three independent experiments. *p < 0.05, **p < 0.01

