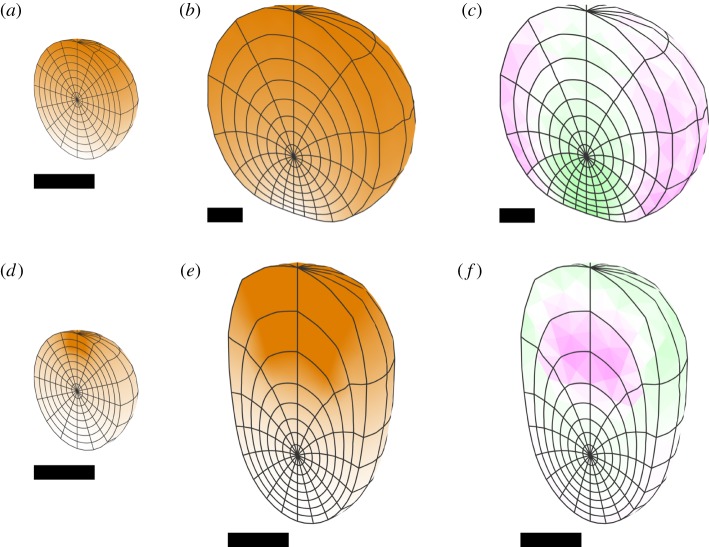
Figure 10.
Gradients of isotropic specified growth in a sphere. (a–c) A linear gradient from bottom to top, showing a cutaway of the initial and final states, and residual strain in the final state. (d–f) Gradient set up from a source at the ‘north pole’ with diffusion and decay. All of the gradients are first set up and then remain fixed in the tissue without further diffusion. The resulting forms are similar if diffusion continues throughout. Orange represents specified growth rate, and magenta/green is the rate of residual compression/tension.

