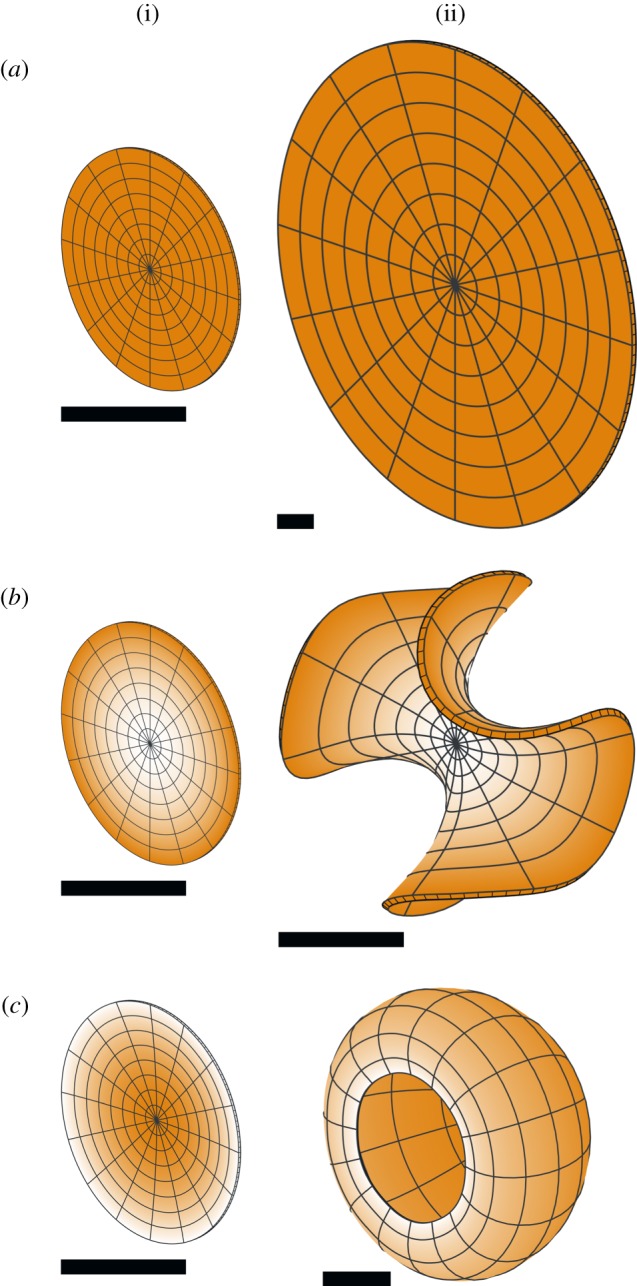
Figure 7.

Isotropic specified growth in a disc of unit radius (shown obliquely), with the same three growth distributions as figure 6: (a) uniform, (b) r2, (c) 1 − r2. Each row shows (i) the initial distribution of growth (orange) and (ii) the growth distribution in the final state. The finite-element decomposition of the disc consists of a single layer of pentahedra (prisms), obtained by dividing a planar disc into triangles and giving them an initially uniform thickness. Specified growth is still isotropic in all three dimensions. A small initial perturbation (invisibly small in the picture of the initial state) is given to each vertex of the finite-element mesh, to break the symmetry and allow buckling to occur. Orange represents specified growth rate. Scale bars are equal to the initial radius of the disc.
