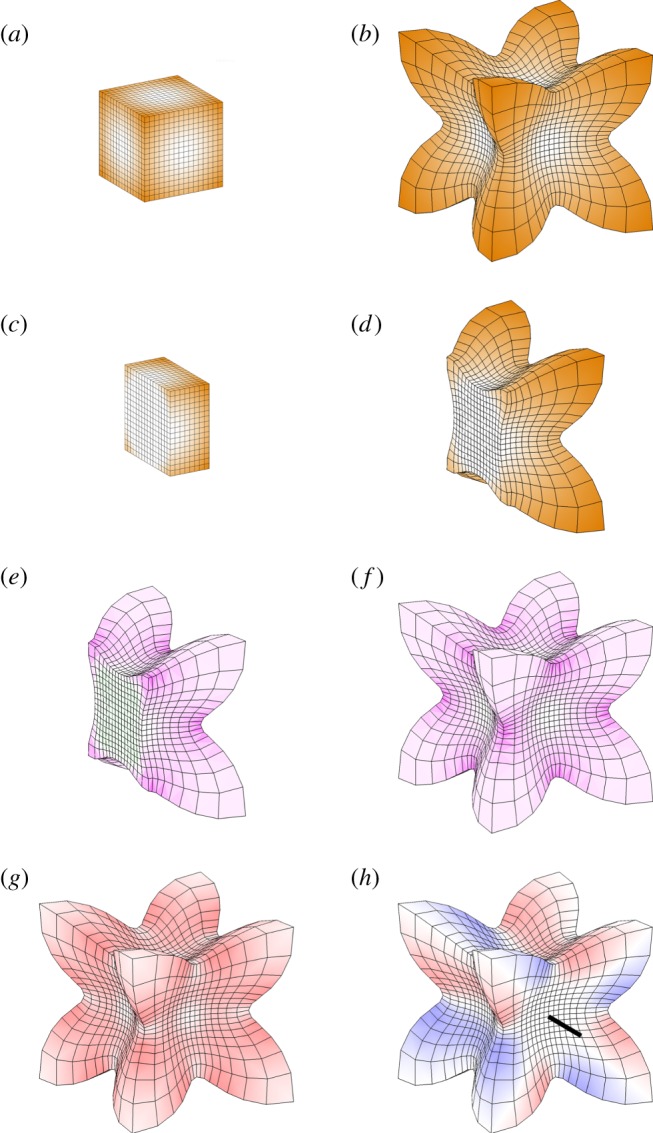
Figure 8.

Non-uniform isotropic growth in a cube. Specified growth is zero from the centre out to the face centres, thereafter increasing linearly with radius to a maximum at the corners. All images are to the same scale. (a–d) Initial and final tissue with specified growth rate in orange, shown as the entire volume (a,b) or section (c,d). (e,f) Residual strain shown as a section (e) or entire volume (f). Magenta indicates compression; green tension (almost invisibly low, but present in the central region). (g,h) Vorticity. The magnitude of the rotation rate (g) is indicated by the intensity of red. (h) Rotation rate about one of the coordinate axes (indicated by the black line), with red representing anticlockwise rotation when viewed looking along that axis, and blue clockwise.
