Fig. 1.
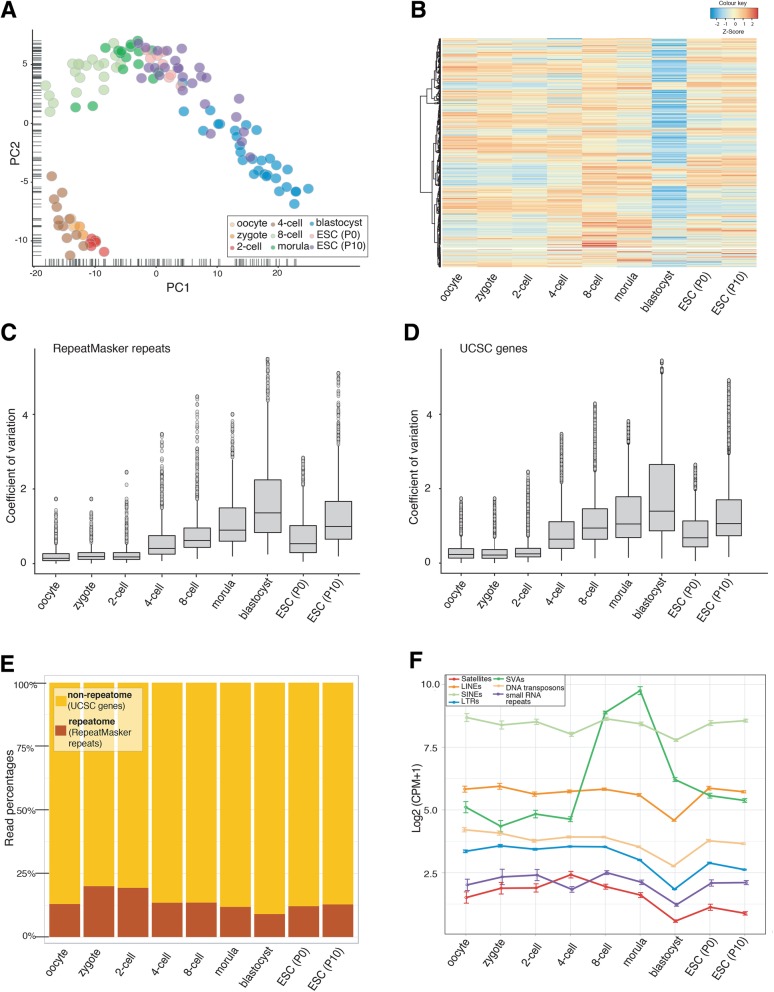
Distinct expression patterns of repeatome across the stages of human pre-implantation and in ICM-derived embryonic stem cells (ESCs). a Principal component analysis (PCA) of repeatome’s expression levels. Each circle represents a single cell in the corresponding developmental stage. b Heat-map representation of the expression levels of all 1116 repeat elements. Each row represents a single repeat and columns represent developmental stages. c Box-plot representation of the coefficients of variation (CV) in repeat expression. d Box-plot representation of the CVs in gene expression. c-d CVs across all single cells in a given developmental stage were calculated for each individual repeat element or gene separately and they were plotted as boxes and whiskers. e Read percentages of repeat-arisen transcripts against all gene-arisen transcripts. Read percentages were calculated from the ratio of the number of all RepeatMasker annotated repeat transcripts over the total transcript number, which is the sum of all repeat-arisen transcripts and the transcripts originated from UCSC annotated genes. f Average expression levels of different repeat classes given as log2[Counts Per Million (CPM + 1)]. Error bars represent the standard error of the mean. [For ESCs; P0:passage 0 and P10:passage10]

