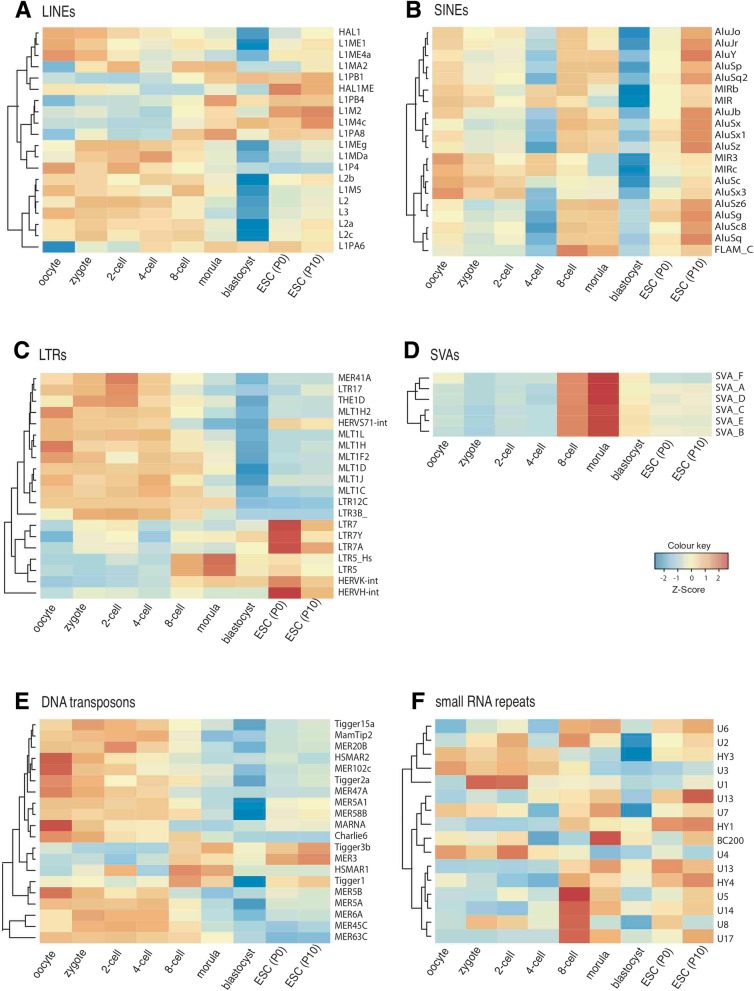
Fig. 3.
Expression dynamics of transposons and small RNA repeats. Heat-maps represent expression levels of top 20 most-variable repeats for (a) LINEs, (b) SINEs, (c) LTRs, (e) DNA transposons, (f) small RNA repeats; and all members of (d) SVA elements. Each row represents a single repeat and columns represent developmental stages

