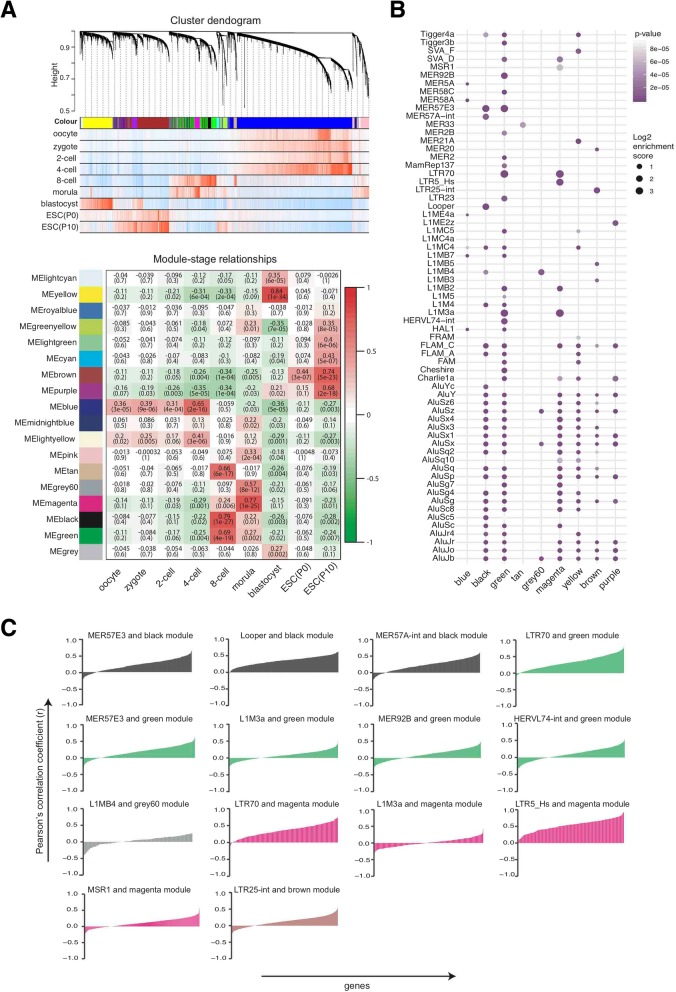
Fig. 4.
Enrichments of repeat elements in the 2-kb upstream promoter regions of stage-specific genes and expression correlations of enriched repeats with these genes. a Weighted Gene Co-expression Network Analysis (WGCNA) of human pre-implantation development stages and ESCs. Upper panel shows the cluster dendrogram with hierarchical clustering of co-expressed gene clusters (modules), which correspond to long branches in the dendrogram and are represented as specific colours underneath each branch. Vertical lines below module specific colours represent the correlation statuses of genes with a particular developmental stage (red: positive correlation, blue: negative correlation). Lower panel shows module-stage relationships. Rows correspond to module eigengenes and columns to human pre-implantation stages and ESC passages. The Pearson’s r correlation coefficients and associated p-values are given in each cell. The colour code indicates the degree of correlation (red: high, green: low). See Additional file 1: Figure S5 for expression heat-maps of module-specific genes as well as Gene Ontology analysis results for these genes. b Dot-plot presenting the enrichment levels of repeats within the 2 kb-upstream promoter regions of genes listed in the corresponding modules. Stage-specific modules were given in columns and repeat elements that exhibit enrichment were given in rows. The radii of dots represent ES and the colour intensity indicates p-values obtained by Fisher’s exact test. c Expression correlations of module-enriched repeats with genes in the corresponding module. The Pearson’s correlation coefficients (r) were calculated using all expression data points from single cells from all developmental stages and ESCs for each enriched repeat (ES > 3.5) and all genes in given modules individually. R correlation coefficients obtained for a particular repeat element and each single gene in the relevant module were presented as stacked columns. Column colours indicate specific repeat-enriched modules (e.g. green colour indicates genes within the 8-cell specific green module). Additional file 1: Figure S8 shows additional interesting repeat-module correlations where ES is less than 3.5 threshold

