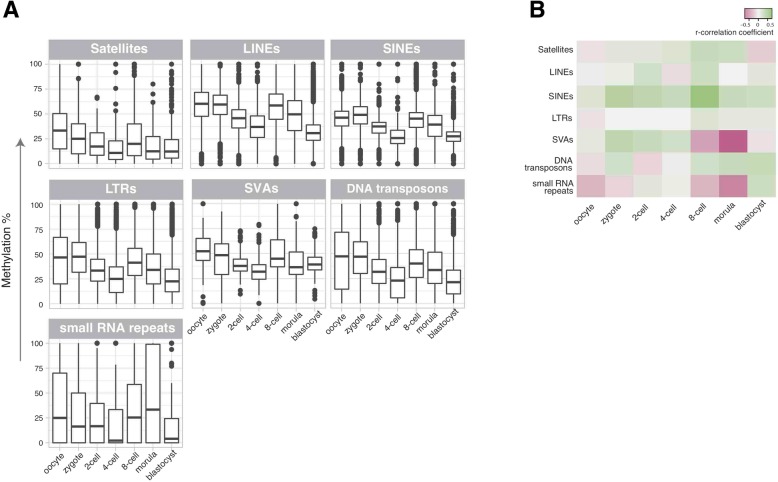
Fig. 5.
DNA methylation dynamics of major repeat classes during human pre-implantation. a Box-plot representations of DNA methylation levels from single cells across stages of pre-implantation categorised by repeat classes. b DNA-methylation and expression correlation heat-map. Each cell in the heat-map represents r-correlation coefficients between the average expression levels obtained from a single cell dataset [36] and average methylation levels for another single cell dataset [76] for all members of a given repeat class in the specified time-frame during pre-implantation

