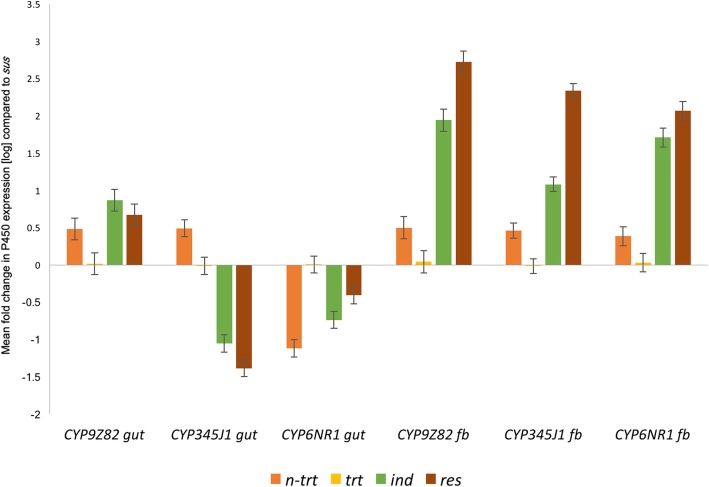
Fig. 10.
The figure represents relative expression of the CYP9Z82, CYP345J1 and CYP6NR1 genes in the gut and fat body tissues of different experiment groups, silenced and imidacloprid treated (trt), silenced and non-treated (n-trt), non-silenced and imidacloprid treated (ind), and field (res), compared to non-silenced and non-treated (sus) group. The bars represent mean fold change in expression compared to sus group. Each sample group was color coded as n-trt (orange), trt (yellow), ind (green) and res (brown). Error bars represent SEM. The statistical significance was measured using Tukey’s HSD with p < 0.05 as the level of significance

