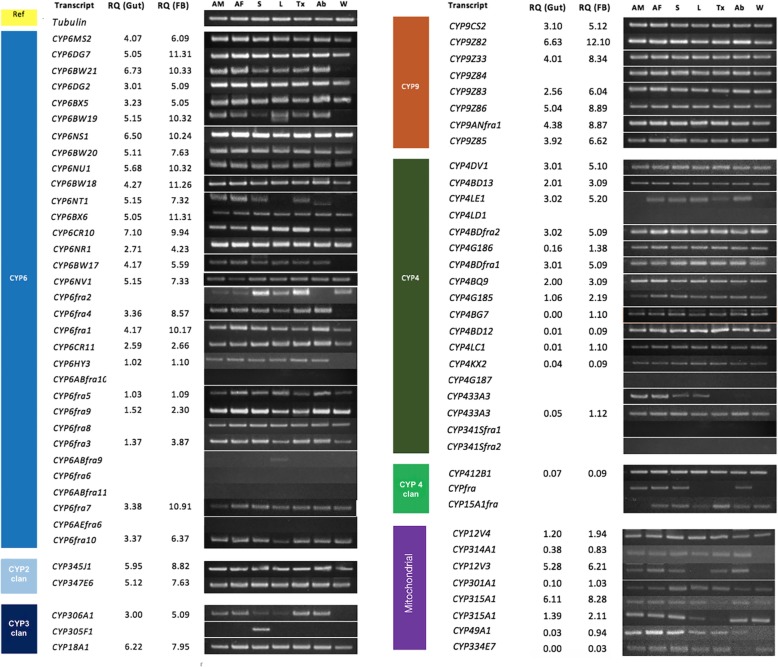
Fig. 4.
Relative tissue-specific expression of P450 transcripts, as analyzed via PCR and visualized in 3% agarose gels. Antenna Male (AM), Antenna Female (AF), Proboscis (S), Legs (L), Thorax (Tx), Abdomen (Ab) and Wings (W) indicate the source tissues. The expression of all P450s in the gut and fat body (FB) tissues was quantified via RT-qPCR, and the mean fold-changes in gene expression compared to tubulin and β-actin are provided under RQ. The oligonucleotide primer details, annealing temperature and amplification size (bp) are given in Additional file 1: Table S1. The 3 kb DNA ladder was used as a marker

