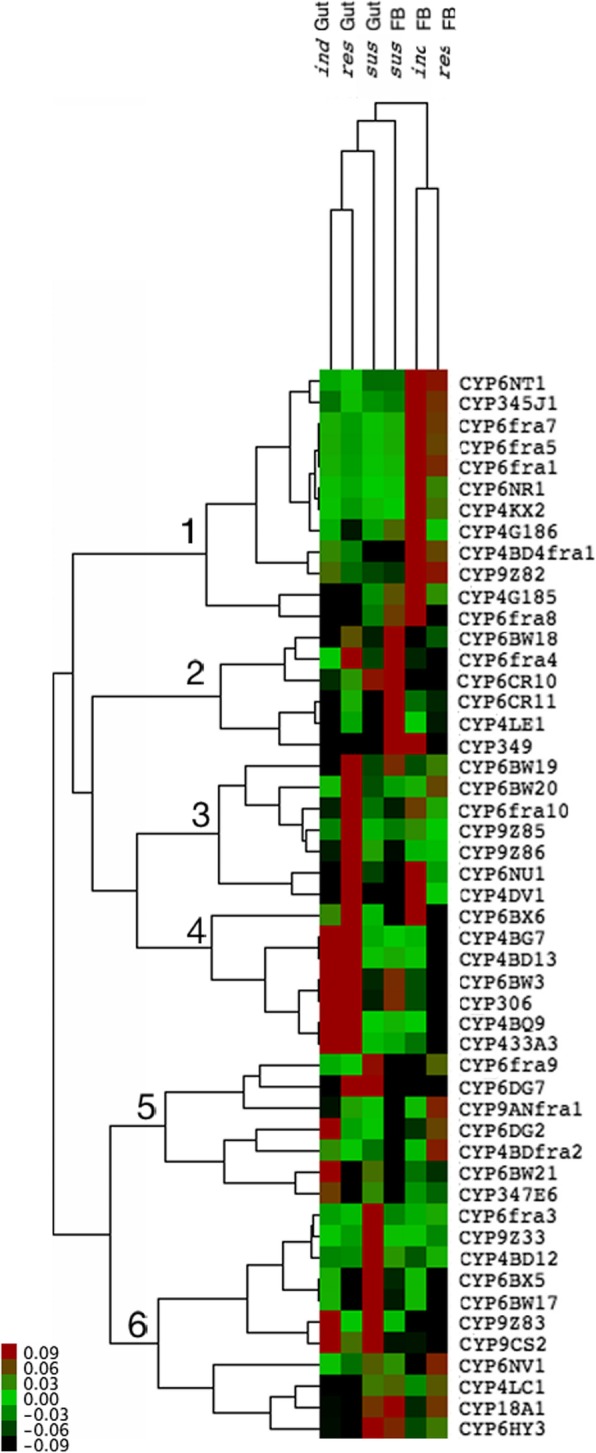
Fig. 7.

Expression profile of P450s in the gut and fat body tissues of sus, ind and res beetles. The relative expression of P450s in each tissue compared to tubulin and β-actin gene expression (2-ΔCт) is represented; red indicates overexpression, while green represents low expression, and black represents moderate expression. The six major clusters identified are indicated in the tree
