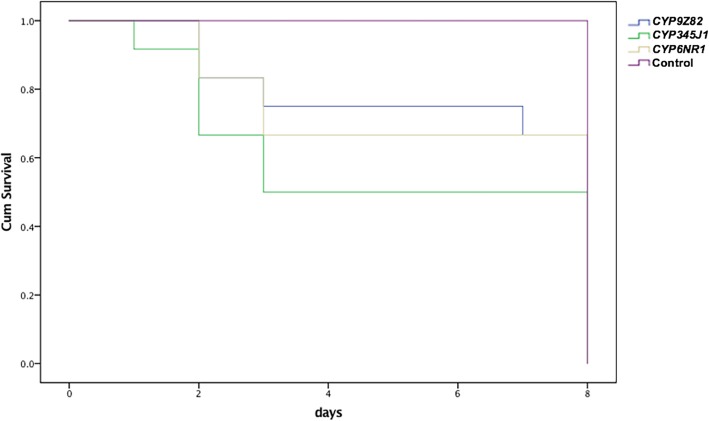
Fig. 9.
The Kaplan-Meier survival analysis provides the survival functions from three groups of P450-silenced insects, represented as CYP9Z82 (blue), CYP345J1 (green), CYP6NR1 (yellow), and control (violet) line diagrams. The experiment was censored after 11 days and the data represents comparison of 8 days, till the survival rate of silenced insects reached 0. The survival functions calculated based on the Mantel-Cox Log Rank test showed no significant difference in survival functions between the silenced groups (p = 0.054, Mantel-Cox Log Rank test)

