
Figure 2.
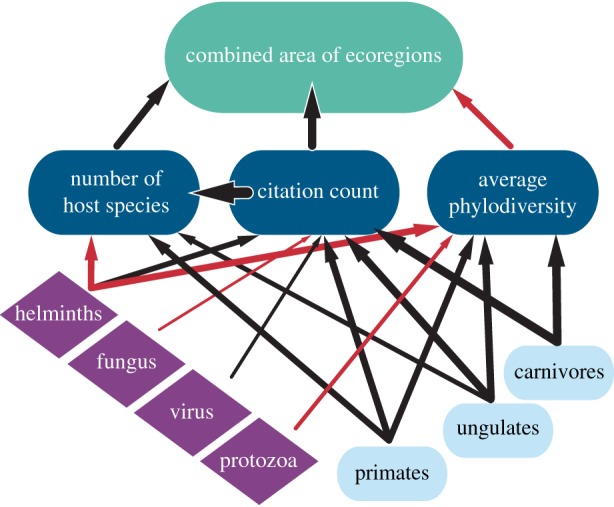
Bayesian network analysis on variables affecting the amount of ecoregion area occupied by 866 mammal parasite species. All continuous variables were log10-transformed for this analysis. For predictor variables, dark blue boxes are the three non-taxonomic variables (average host phylogenetic diversity, number of host species, and citation count); purple boxes are parasite groups; and light blue boxes are host groups. Thickness of arrows represent the strength of log-normalized conditional probabilities of significant dependencies between variables (2.5 × (ln (|x|) + 2)) and the direction of effect is indicated by colour (black = positive; red = negative effects). Electronic supplementary material, table S2 reports the overall structure of these relationships.