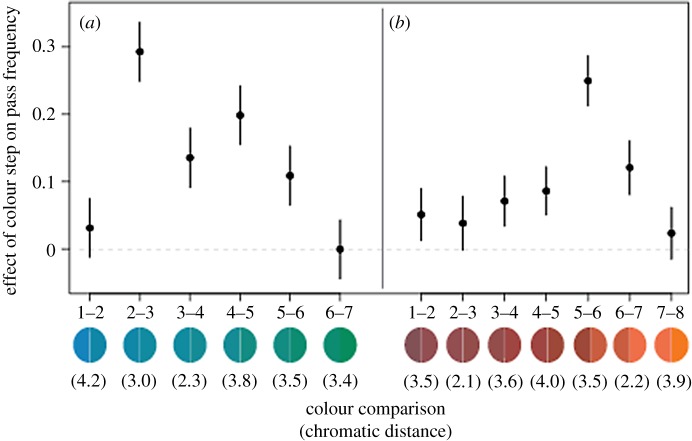
Figure 4.
Comparing results from the (a) blue–green and (b) orange–red datasets. The effects of each colour step on pass frequency, resulting from a model which simultaneously considers data from colour steps 1, 2, 3, 4, 5 and 6 steps apart. Points and bars represent estimates and 95% confidence intervals corresponding to the contribution of each colour step to birds' pass frequency. The coloured circles indicate the two Munsell colours that fall on either end of a given step. Note that the colour steps with the greatest effect on pass frequency are not those that span the greatest chromatic distance (indicated in brackets). (Online version in colour.)

