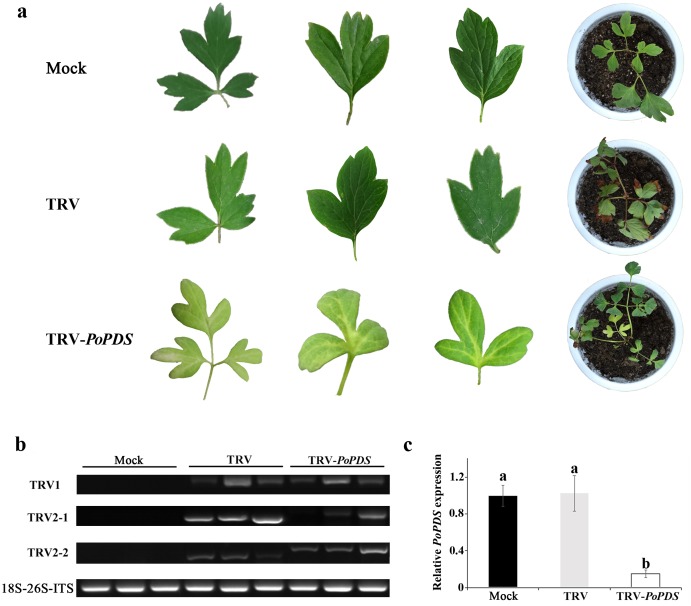
Figure 3. Silencing of PoPDS in P. ostii leaves infected with TRV-PoPDS.
(A) Representative phenotypes of mock treated, TRV-(empty vector), and TRV-PoPDS-infected leaves in P. ostii seedlings. Photobleaching phenotypes were observed in the first newly-developed leaves of seedlings at 5 weeks post infiltration with TRV-PoPDS. (B) Semi-quantitative RT-PCR analysis of TRV1 and TRV2 accumulation levels in agro-infected P. ostii leaves. (C) Quantitative real-time PCR analysis of PoPDS in agro-infected P. ostii leaves. 18S-26S internal transcribed spacer (18S-26S ITS) was used to normalize the transcript levels, and relative expression values were calculated compared with the highest expression value taken as 1.0 (untreated). Error bars represent ± SE of data from three independent experiments. The different letters indicate significant differences using Duncan’s multiple range test at p < 0.05.

