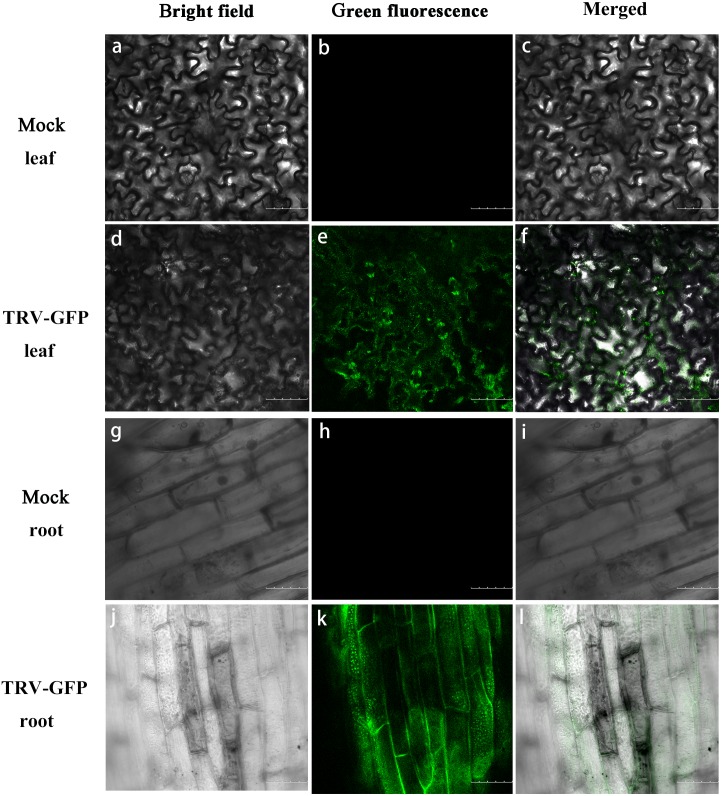
Figure 4. GFP expression in P. ostii. leaves and roots inoculated with TRV-GFP.
Confocal microscopy image of P. ostii. leaves and roots infected with TRV-GFP at 5 days post-infiltration (dpi). Fluorescence was not observed in leaves (A–C) and roots (G–I) of mock-treated plants. The bright field (A, D, G, J), the GFP channel (B, E, H, K), and the merged images (C, F, I, L) of the bright field and the GFP channel are shown. Scale bars equal to 100 µm (A–F) or 75 µm (G–L).

