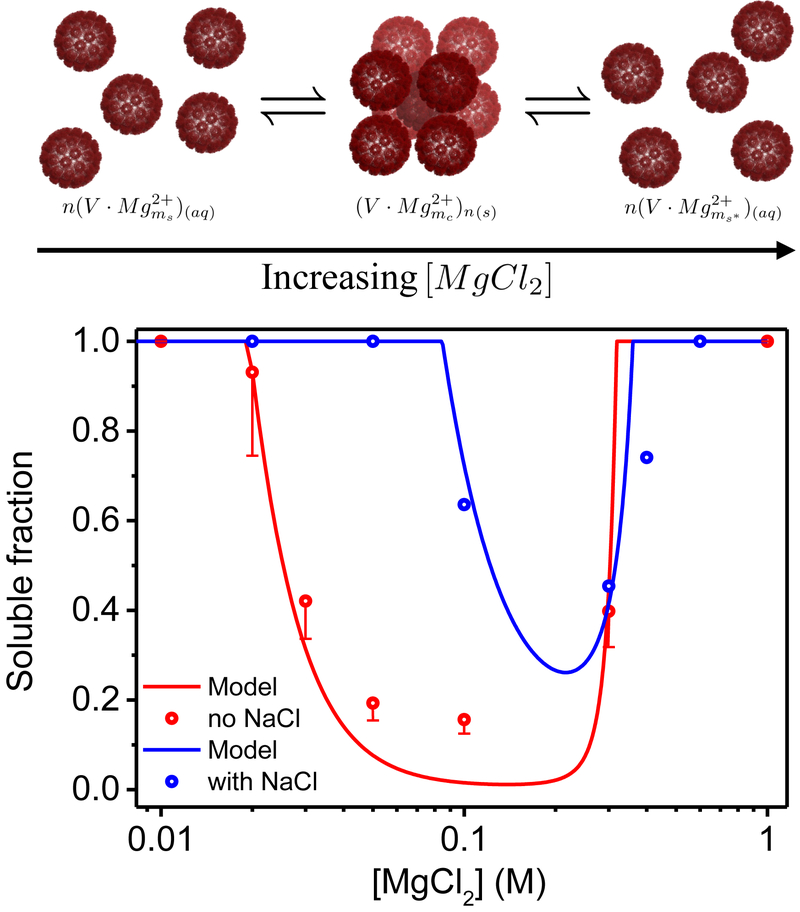
Figure 3:
The fraction of soluble virus, χs, as a function of MgCl2 concentration. The scattered circles are the experimentally measured χs obtained from the fitting of the normalized scattering curves (Figure 2). The blue circles correspond to the data set with 500mM NaCl and the red circles correspond to the measurements without added NaCl. The error bars of the red circles represent the maximum possible deviation in the values of the solubility that result from multiplying the form factor by a scaling factor of 0.8 ± 0.01, as described in Material and Method. The red and blue curves represent the theoretically predicted soluble fractions based on our thermodynamic model, in which the Mg2+ adsorption energies ϵs = ϵnb and ϵb were −0.805 and −1.851 for the red curve and −0.260 and −1.262 for the blue curve. The number of possible binding sites per pentamer, N, was 20 and the fraction of pentamers that can form bridges in the BCC 10 lattice, fp, was in both cases. The cartoon illustrates crystallization and reentrant and resolubilization processes with increasing the MgCl2 concentration. The virus cartoon is based on PDB ID 1SVA54 and was created using PyMOL software.57

