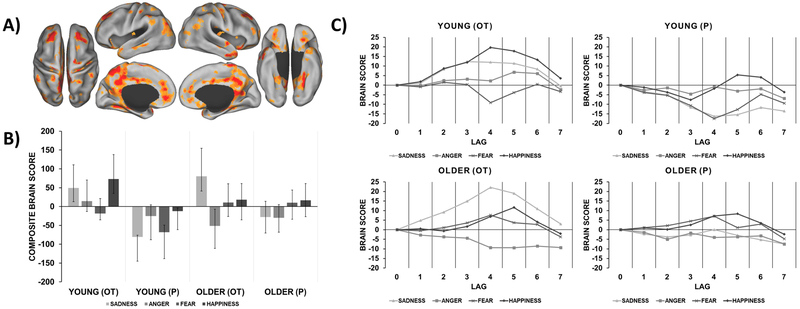
Figure 2.
Treatment- and emotion-specific brain pattern relating to dynamic facial emotion identification. A) Functional activation map with warm colors that correspond to the brain pattern recruited by young participants in the OT group for sadness and happiness and older participants in the OT group for sadness only. This brain pattern was mapped at the time point of greatest temporal dissociation between treatment groups (lag 4). B) Composite brain scores plot depicting the contrast in pattern recruitment for each condition and group (95% CI). C) Temporal brain scores plot that shows brain scores corresponding to each lag in the designated time window after trial onset.

