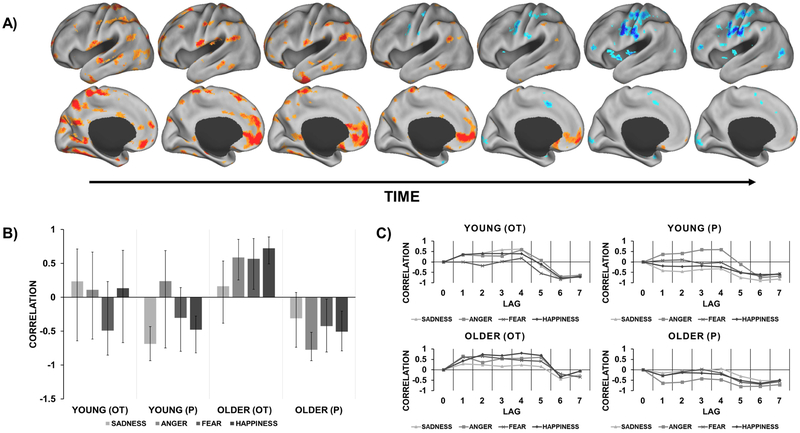
Figure 4.
Emotion-specific amygdalar networks for older participants that varied by OT vs. P. A) Functional connectivity maps (1 map per lag in medial and lateral view) that represents the temporal unfolding of two distinct age- and emotion-specific amygdala networks further distinguished by treatment (OT vs. P). Warm colors correspond to an amygdala network recruited by older participants in the OT group for anger, fear, and happiness that emerged early in the task. Cool colors correspond to an amygdala network recruited by older participants in the P group for these same emotions that emerged later in the task. B) Composite correlation plot depicting amygdalar connectivity for each condition and group (95% CI). Note that these networks were not reliable for older participants in response to sadness due to CIs crossing zero. C) Temporal correlation plot that shows correlations corresponding to each lag in the designated time window after trial onset.

