Figure 1.

Expression of total and acetylated histones (H3, H4) in control and Vorinostat-treated U87 cells (A). Bar graph illustrating the average change in U87 cell number in response to Vorinostat treatment (B).

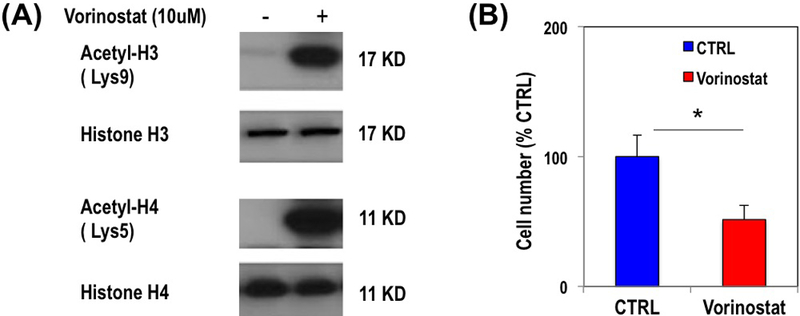
Expression of total and acetylated histones (H3, H4) in control and Vorinostat-treated U87 cells (A). Bar graph illustrating the average change in U87 cell number in response to Vorinostat treatment (B).