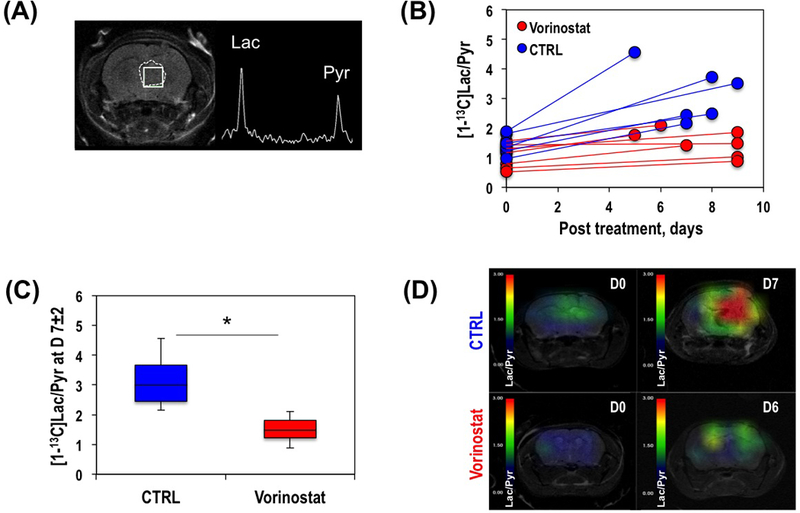
Figure 5.

Anatomical axial T2-weighted image of a representative mouse showing tumor area (dashed line) and tumor voxel (solid line), and corresponding hyperpolarized 13C MRSI spectrum from the tumor voxel (A). Individual hyperpolarized [1-13C]Lac/Pyr at D7±2 in control and Vorinostat-treated tumors (B). Average hyperpolarized [1-13C]Lac/Pyr at D7±2 (C). Hyperpolarized [1-13C]Lac/Pyr heat map at D0 (top) and D7±2 (bottom) of control (left) and Vorinostat-treated (right) mice bearing U87 tumor (D).
