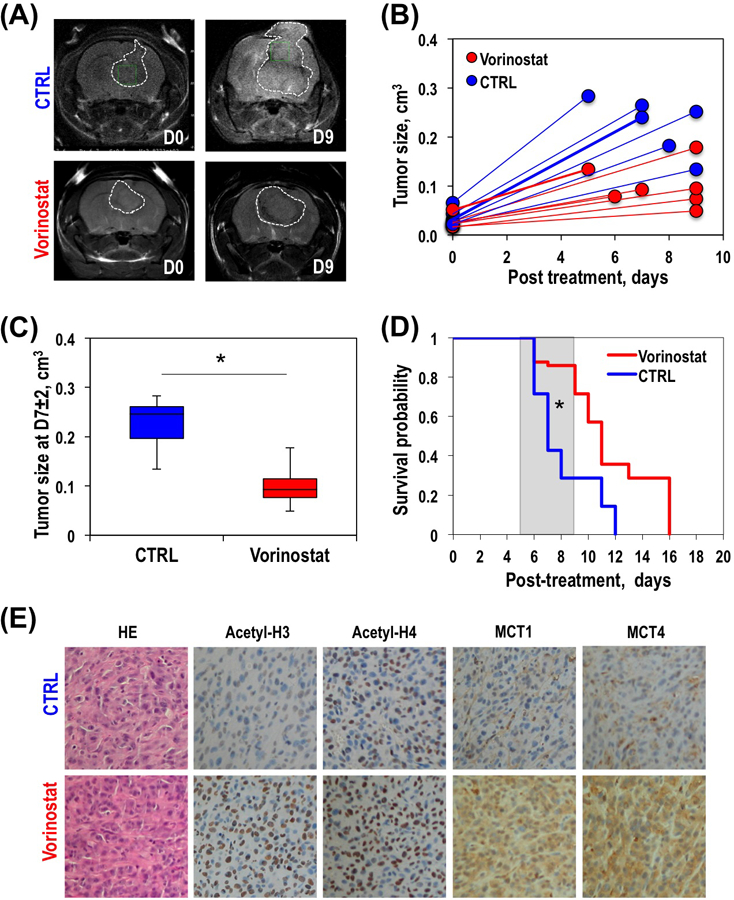
Figure 6.

Anatomical T2-weighted images of a representative control (top panel) and Vorinostat-treated (bottom panel) U87 tumor-bearing mice at D0 (left) and D7±2 (right) (A). Temporal evolution of individual (B) and average at D7±2 (C) tumor size of control and Vorinostat-treated U87 tumors. Kaplan-Meier survival plot of U87-bearing control and Vorinostat-treated mice (D). Immunohistochemical analysis of control and Vorinostat-treated U87 tumors. Expression of acetyl-H3, acetyl-H4, MCT1 and MCT4 for each treatment group at the end of the study (E). All histological images are the same magnification (20x).
