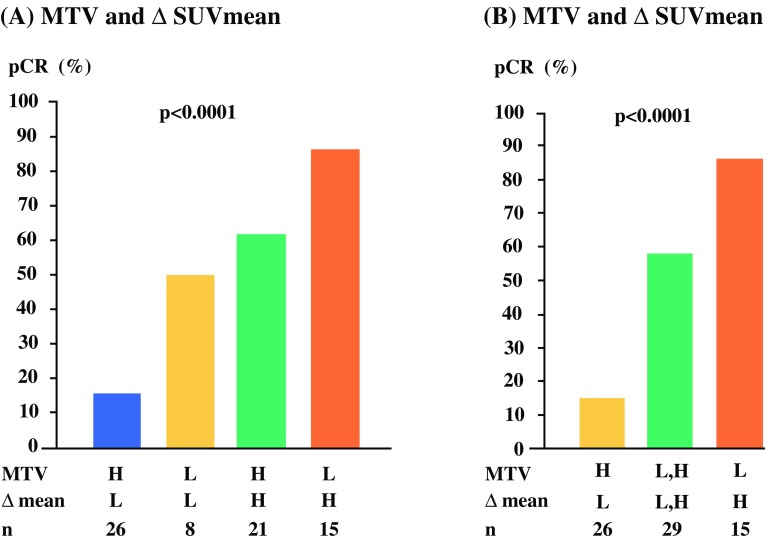
Fig. 2.
pCR rates according to the combination of MTV at baseline and ∆SUVmean. The pCR rates of a four groups and b three groups after combining both high and both low MTV and ∆SUVmean. pCR pathological complete response, MTV metabolic tumor volume, SUVmean mean standardized uptake value, H high, L low, ∆ reduction rate

