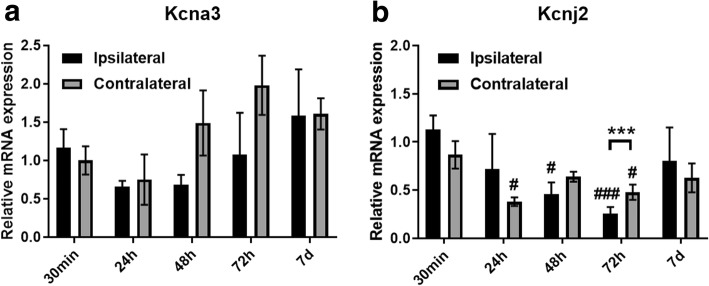
Fig. 4.
Kv1.3 and Kir2.1 potassium channel gene expression in CNS-MPs post-tMCAO. Comparison of Kv1.3 (a) and Kir2.1 (b) gene expression in CNS-MPs isolated from ipsilateral and contralateral hemispheres at different timepoints following tMCAO by qRT-PCR (Hprt used as housekeeping gene). N = 3 mice/group, error bars represent standard error of mean. *indicates comparisons between hemispheres (*p < 0.05, **p < 0.01, ***p < 0.005) at a particular timepoint. #indicates comparisons within ipsilateral or contralateral hemispheres across timepoints using 30 min timepoint as reference (#p < 0.05, ##p < 0.01, ###p < 0.005)

