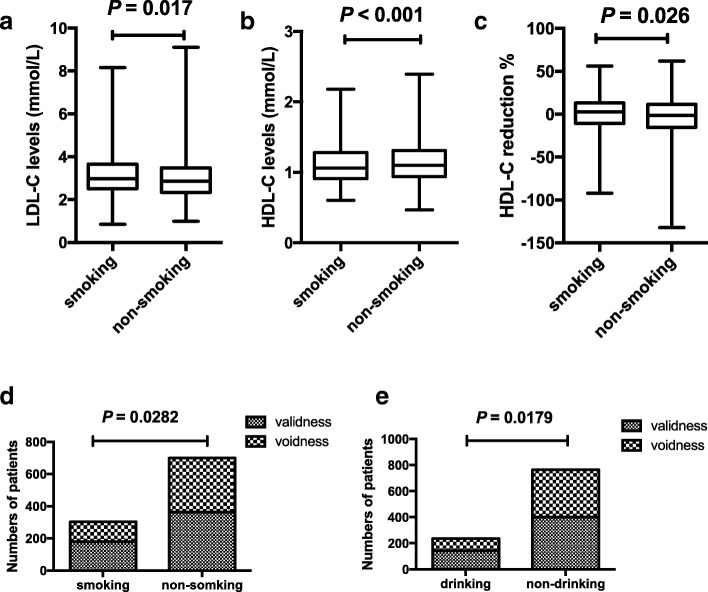
Fig. 3.
Associations between lifestyles and statins responses The difference between smoking patients and non-smoking patients in LDL-C (a) and HDL-C (b) baseline levels. The difference in he HDL-C response to statins in smoking and non-smoking groups (c). Associations between lifestyles and statins responses to LDL-C. (d: smoking status, e: alcohol drinking status). “validness” means the LDL-C reduction percentage ≥ 25%, and “voidness” means the LDL-C reduction percentage < 25%.

