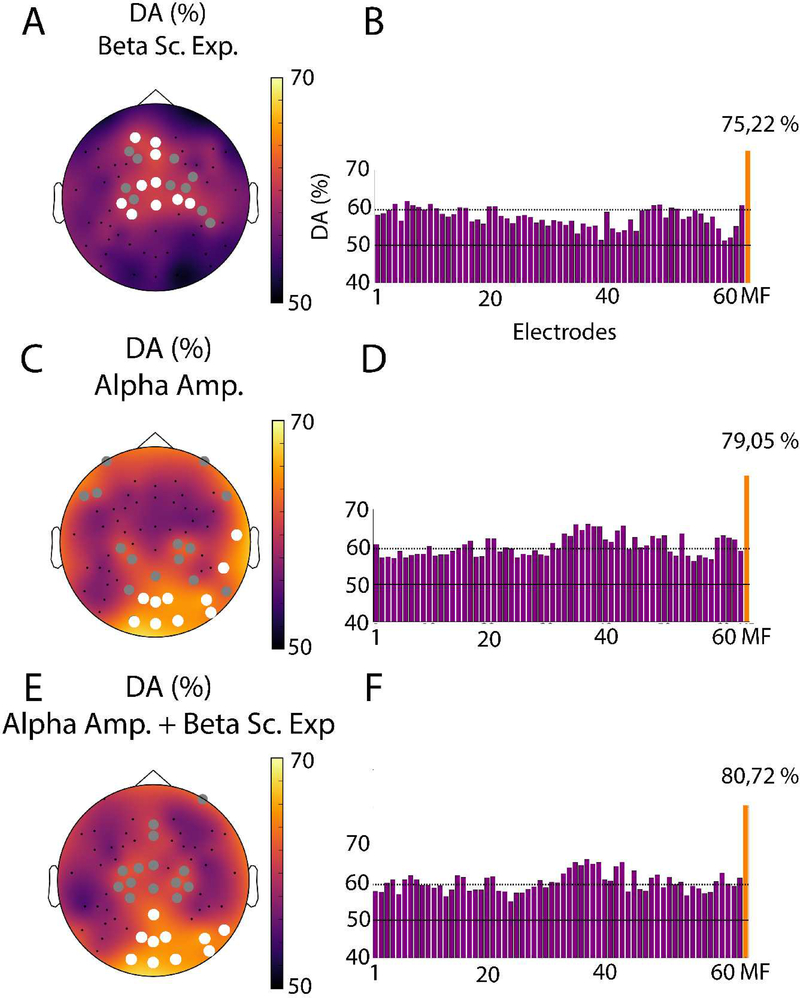
Figure 5. Topographical maps of single-trial decoding performance (Conscious vs. Unconscious).
Topographical maps (left) and bar charts (right) of the single-feature decoding accuracy (DA) for the beta band scaling exponents (A,B), alpha amplitude (C,D), as well as the beta scaling exponent and the alpha amplitude combined (E,F). All circles in panels (A), (C) and (E) indicate electrodes where the DA was statistically significant (p<0.001, corrected). Among these, the ten that had the highest decoding accuracies are labeled with a white circle. The continuous horizontal lines on the bar charts depict the theoretical chance level (50%), while the dotted lines represent the statistical significance threshold (p<0.001, corrected). The orange bar to the right of each bar plot represents the decoding accuracy obtained with the multi-feature decoding method described above.

