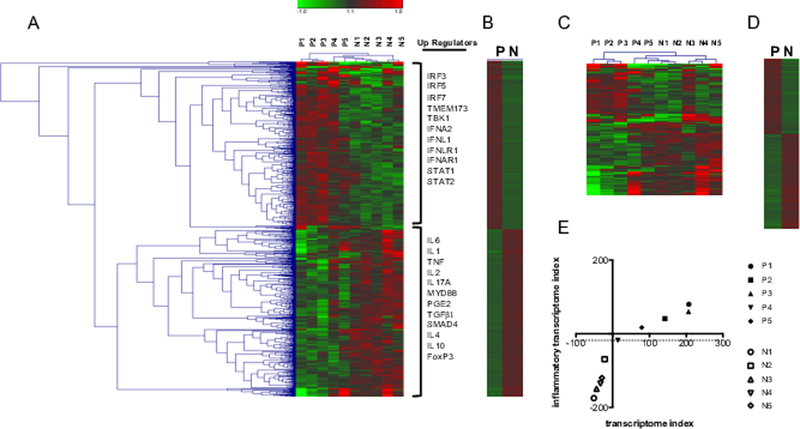
Figure 1. Serum-induced transcriptome.

(A) Heatmap of transcripts with 1.2-fold difference and p≤0.01 showing upstream (up) regulators as identified in IPA. n=727 (B) Heatmap of the mean log2 intensity of transcripts shown in A. (C) Heatmap of inflammation-related transcripts as identified in IPA and DAVID with 1.2-fold difference and p≤0.01. n=194. (D) Heatmap of the mean log2 intensity of transcripts shown in C. (E) Graph showing segregation of progressed and not progressed PDAC patient cohorts based on the transcriptome and inflammatory transcriptome indices.
