
Figure 4. Immunohistochemical analysis of CD8+ T cells in PDAC tumor.
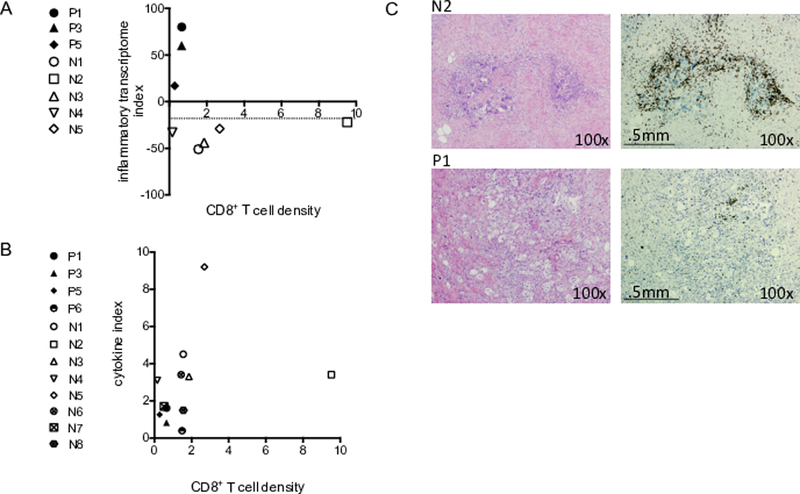
Graph of CD8+ T cell density with the inflammatory transcriptome index (A) and cytokine index (B). P = Progressed and N = Not progressed. (C) A representation of tumor tissue sections stained with hematoxylin and eosin (panel 1) and anti-CD8 (panel 2). N2 is not progressed patient 2 (top) and P1 is progressed patient 1 (bottom).