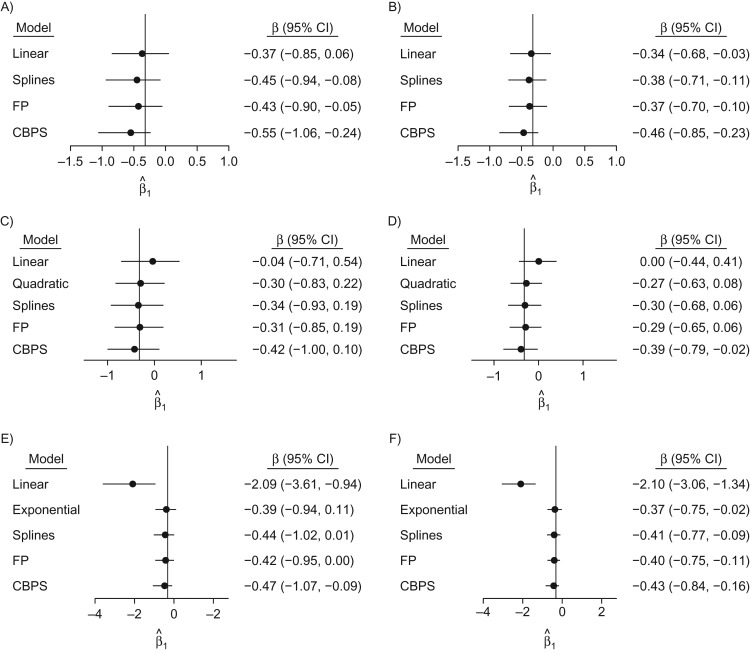
Figure 1.
Effect estimates and their variability in single-interval simulations, as indicated by 95% bootstrap confidence intervals, for n = 250 (left column) and n = 500 (right column) when the true covariate-exposure relationship is linear (top row), quadratic (middle row), or exponential (bottom row). True values are denoted by the vertical line. CBPS, covariate-balancing propensity score; CI, confidence interval; FP, fractional polynomial.

