Figure S1.

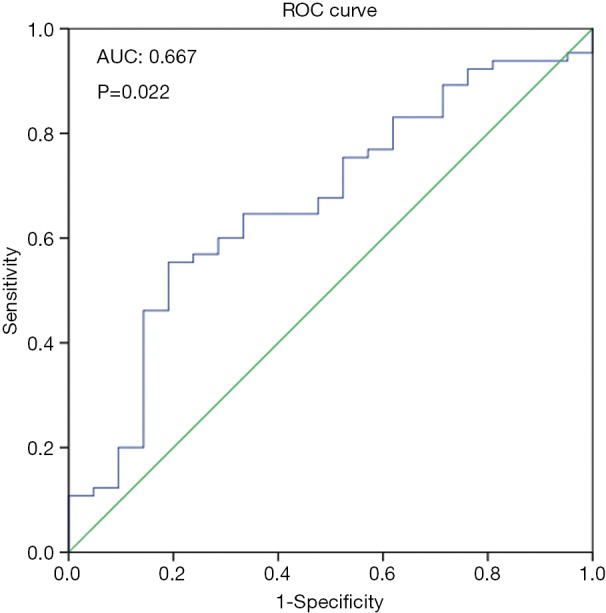
ROC curve built to classify the expression of IQCJ-SCHIP1-AS1 into a relatively high group versus a relatively low group on the prognosis of 86 patients with CRC. IQCJ-SCHIP1-AS1, IQCJ-SCHIP1 antisense RNA 1; CRC, colorectal cancer.

ROC curve built to classify the expression of IQCJ-SCHIP1-AS1 into a relatively high group versus a relatively low group on the prognosis of 86 patients with CRC. IQCJ-SCHIP1-AS1, IQCJ-SCHIP1 antisense RNA 1; CRC, colorectal cancer.