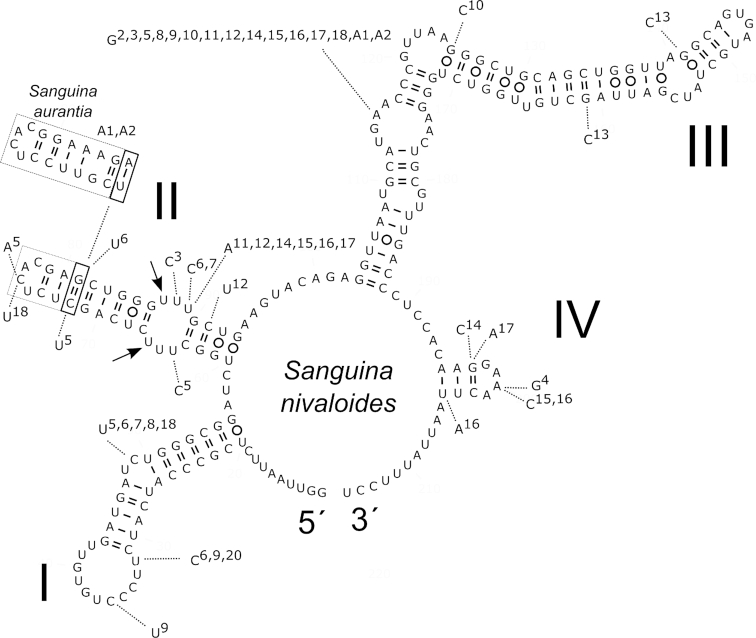
Figure 10.
Comparison of the secondary structure of the ITS2 rDNA transcripts of 18 haplotypes of Sanguina nivaloides (H1-H18) and two haplotypes of Sanguina aurantia (HA1, HA2). Helices are labelled with Latin numbers (I-IV). Nucleotide differences of all haplotypes are shown outside the structure and are linked by dotted lines. Numbers 2–18, A1 and A2 indicate in which haplotype the difference was detected when compared to haplotype number 1 of Sanguina nivaloides (represented by the holotype specimen CCCryo RS_0015–2010, accession number MK728599). One compensatory base change between Sanguina nivaloides and Sanguina aurantia is indicated by the bold rectangle. The dashed rectangle at the end of helix II is showing an expansion segment (length is not conserved). Note: the U–U mismatch in helix II (arrows). The 5´ and 3´ ends of the ITS2 transcript are indicated.

