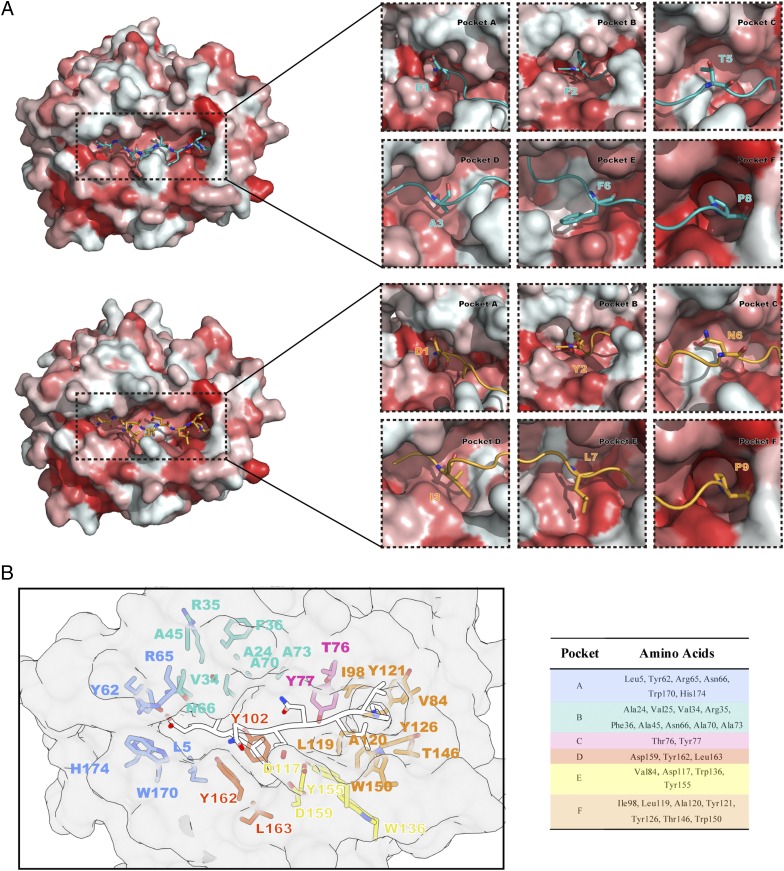
FIGURE 3.
Pocket view and surface comparison between p/Ptal-N*01:01/HEV-1 and p/Ptal-N*01:01/HEV-2. (A) On the left is the model of Ptal-N*01:01/HEV-1 (up) and Ptal-N*01:01/HEV-2 (down), surface colored according to the Eisenberg hydrophobicity scale. Hydrophilic amino acids to hydrophobic amino acids are colored in a gradient from white to red. On the right is a comparison between six pockets of p/Ptal-N*01:01/HEV-1 and p/Ptal-N*01:01/HEV-2. The pockets and corresponding amino acids are labeled. The peptides of p/Ptal-N*01:01/HEV-1 (teal) and p/Ptal-N*01:01/HEV-2 (bright orange) are shown in cartoon and stick representation. (B) The pocket residues are colored and labeled with corresponding amino acid abbreviations and sequence numbers, as shown in the table on the right, and peptide HEV-2 is shown in cartoon representation with 50% transparency in white.

