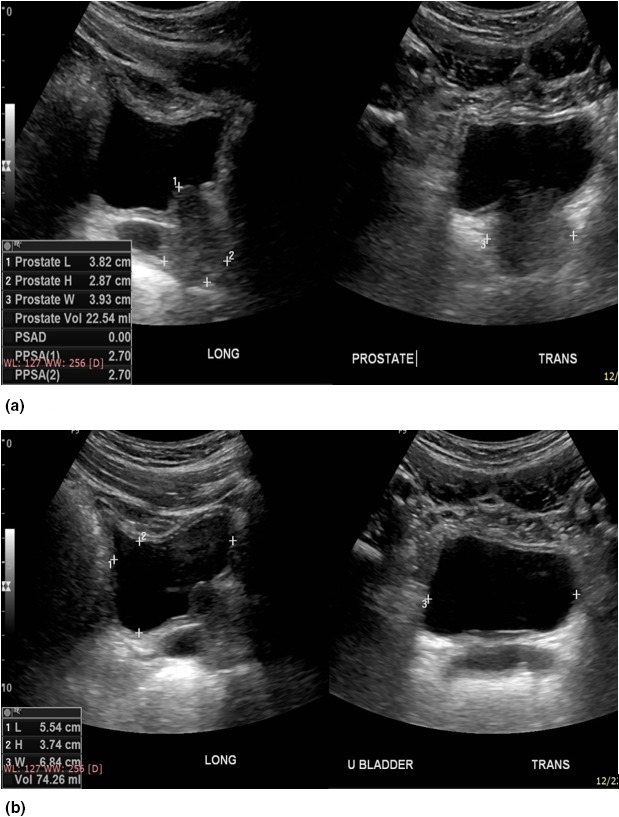
Figure 2.

Pelvic ultrasound of the same patient in Figure 1, done with a urine volume of 74.3 mL shows a prostate volume of 22.5 mL. The images on the left of Figure 2 are the longitudinal images whilst the images on the right are transverse images. The margins of the prostate are again well demonstrated in image (A) for optimum prostate volume measurement, whilst the urinary bladder is well‐centred in image (B) for optimum urine volume measurement. The three pairs of callipers, 1+, 2+ are again shown on the longitudinal image for the cranio‐caudal and antero‐posterior images, and 3+ for the transverse measurements.
