
Figure 4.
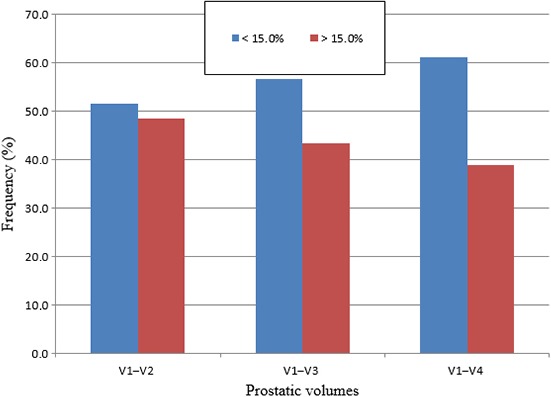
Chart comparing percentage volume difference of prostate measurements taken at urinary bladder volumes of V1 versus V2, V3, V4. The chart shows the percentage of males who had percentage volume differences of <15% and >15%, when prostate volumes were measured at V1 and compared to three other urinary bladder volumes V2, V3 and V4.