Figure 2.

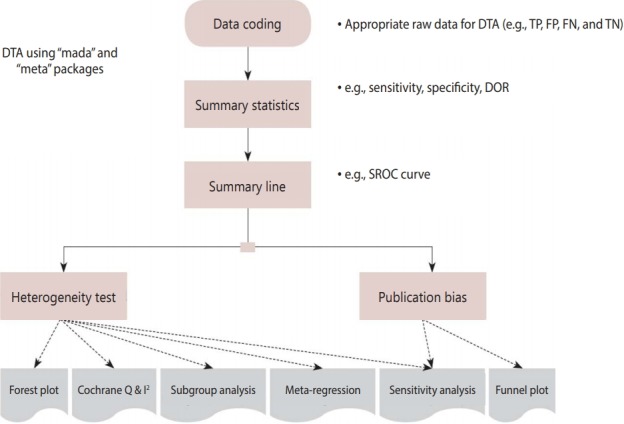
Flow chart of diagnostic test accuracy (DTA) using R “mada” & “meta” package. TP, true positive; FP, false positive; FN, false negative; TN, true negative; DOR, diagnostic odds ratio; SROC, summary receiver operating characteristic.

Flow chart of diagnostic test accuracy (DTA) using R “mada” & “meta” package. TP, true positive; FP, false positive; FN, false negative; TN, true negative; DOR, diagnostic odds ratio; SROC, summary receiver operating characteristic.