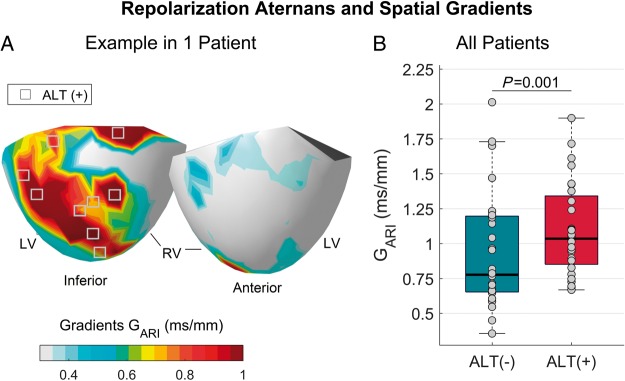
Figure 4.
Interaction between alternans and spatial gradients of repolarization. (A) The magnitude of spatial gradients of repolarization is colour-coded in a representative patient’s heart. Grey squares represent alternans-susceptible sites and are predominantly located in red regions, indicating large repolarization gradients. (B) Mean spatial gradients of repolarization (GARI) in alternans-susceptible, ALT (+), as compare to alternans-resistant sites, ALT (−). Each point shows the mean intra-patient repolarization gradient measured by averaging the gradients across all alternans-susceptible and resistant sites. The box shows the 25th–75th percentile range and the horizontal red line the inter-subject median. Differences were statistically significant (P = 0.001, Wilcoxon signed-rank test). APD, action potential duration; ARI, activation-recovery interval; LV, left ventricle; RV, right ventricle.

