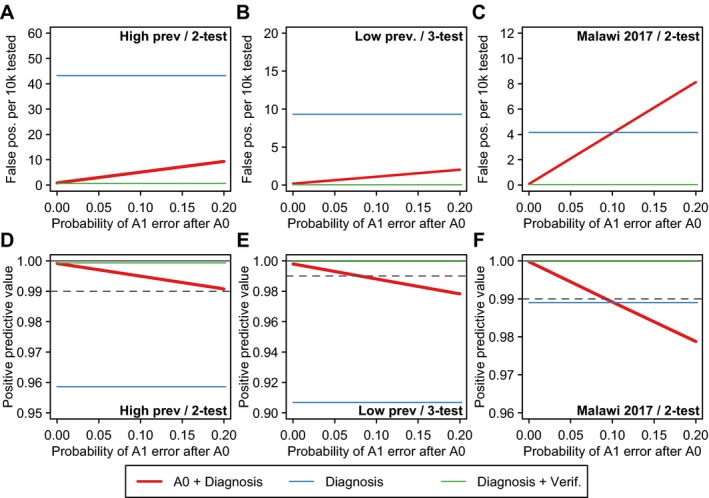
Figure 3. Sensitivity analysis about the probability of excess reader error for A1 test if presenting following a false‐reactive result of the A0 RDT. (A to C) illustrate the effect on the expected number of false positive misclassifications per 10,000 HIV negative persons tested and (D to F) illustrate the positive predictive value (PPV) of the overall testing strategy, conservatively assuming 90% sensitivity.

Red line illustrates scenario in which clients present to HTS following a reactive A1 test and undergo the national HIV testing algorithm once (Figure 1D). For benchmarking, the blue horizontal line indicates the results for status quo HIV testing without verification testing (Figure 1A) and the green line indicates status quo testing with verification testing (Figure 1B). For PPV results (D to F), the grey dashed line indicates the 99% PPV threshold recommended by WHO Consolidated HIV Testing Guidelines. HTS, HIV testing services; RDT, rapid diagnostic test.
