
Figure EV4. Comparison of K1/K10‐1B and vimentin‐1B tetramer structures.
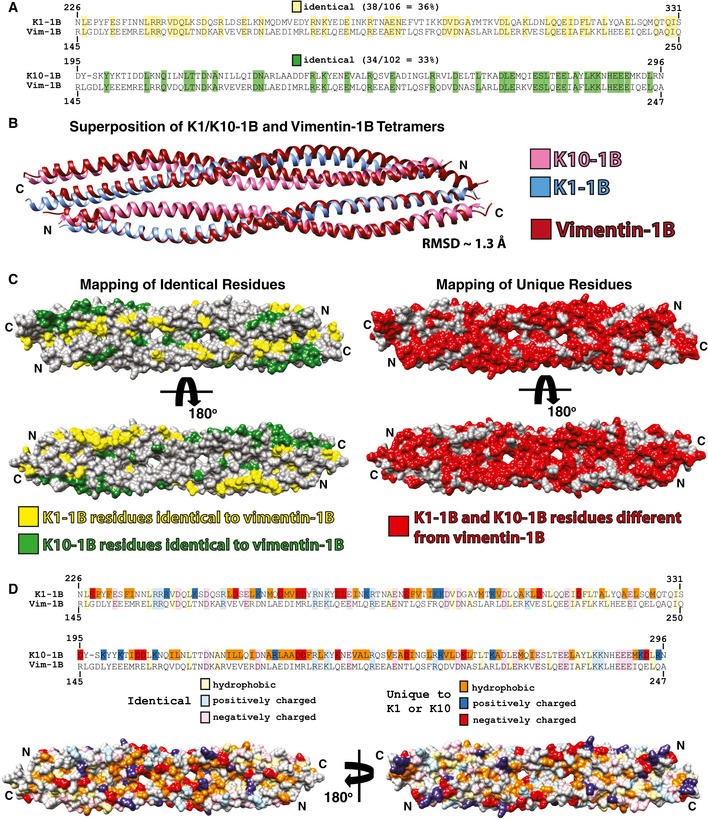
- Sequence alignments of K1‐1B and K10‐1B each with vimentin 1B. There is 36% sequence identity between K1‐1B and vimentin 1B (yellow), and 33% sequence identity between K10‐1B and vimentin 1B (green).
- The wild‐type K1/K10‐1B and vimentin‐1B (PDB Code 3UF1) tetramer structures were superimposed and have a RMSD of 1.3 Å.
- The keratin residues that are identical to vimentin 1B were mapped onto a molecular surface representation of the K1/K10‐1B tetramer structure and colored yellow (K1‐1B) or green (K10‐1B). All K1/K10‐1B residues not identical to vimentin 1B were mapped onto the molecular surface of the K1/K10‐1B tetramer structure and colored red, demonstrating a significant proportion of the K1/K10‐1B molecular surface will have differences in chemistry compared to vimentin 1B.
- To further illustrate how the molecular surface of the K1/K10‐1B tetramer differs from vimentin 1B, both identical residues (lighter colors) and residues unique to K1 or K10 (darker colors) were divided into hydrophobic, positively charged, and negatively charged groups and mapped onto the K1/K10‐1B tetramer molecular surface. The majority of the unique hydrophobic residues are located in the central region of the 1B domain, whereas the unique charged residues appear evenly distributed. Definitions of residues were acidic (D, E), basic (K, R), and hydrophobic (A, F, I, L, M, P, V, W).