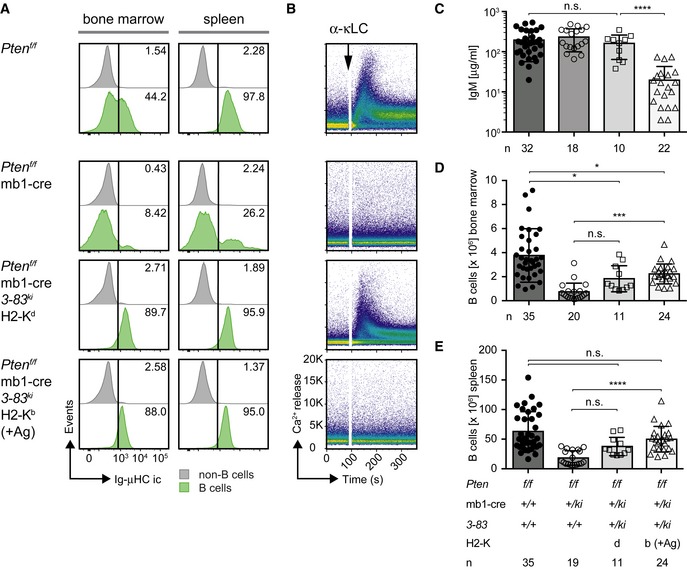
Figure 2. Pten‐deficient B cells are capable of acquiring an anergic phenotype.

-
AIntracellular expression of IgM (Ig‐μHC ic) in bone marrow (left) and spleen cells (right) was determined by flow cytometry and compared between the populations of B cells (green, identified by B220 and CD19 expression) and non‐B cells (gray). Numbers in the histograms indicate the percentages of the positive populations. Figures are representative of 11–35 individual mice per genotype.
-
BIntracellular Ca2+ influx was measured in CD90.2/Thy1.2− splenocytes derived from mice of the indicated genotypes following stimulation with 10 μg/ml α‐κLC antibody. Figures are representative of at least three individual mice per genotype.
-
CSerum IgM concentrations measured in mice of the indicated genotypes. Mean ± SD, symbols represent IgM concentrations from individual mice (n). Statistical significance was calculated by using the Kruskal–Wallis test (see also Appendix Table S1), n.s. = not significant; ****P ≤ 0.0001.
-
D, EAbsolute numbers of B cells in bone marrow (D) and spleens (E) from mice of the respective genotypes, determined by B220/CD19 surface expression. Mean ± SD, symbols indicate the numbers of B cells in individual mice (n). Statistical significance was calculated by using the Kruskal–Wallis test (see also Appendix Tables S2 and S3), n.s. = not significant; *P ≤ 0.05; ***P ≤ 0.001; ****P ≤ 0.0001.
