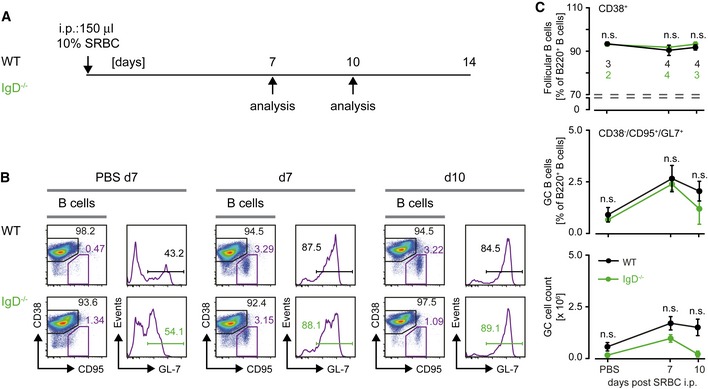
Figure EV4. Immunization of WT and IgD−/− with sheep red blood cells (SRBC) (related to Fig 7).

- Schematic overview of immunization procedure of mice with sheep red blood cells (SRBC) and analysis of germinal center (GC) reactions at different time intervals. Control animals were injected intraperitoneally (i.p.) with PBS and quantified as 0 days of immunization.
- Analysis of GC B cells in spleens from SRBC‐immunized WT or IgD−/− mice. Percentages of follicular B cells (Fo.B; CD38+/CD95−) and GC B cells (CD38−/CD95+) are depicted in the plots. GC B cells (CD38−/CD95+) were further analyzed for GL‐7 expression.
- Quantification of follicular B cells (top, percentages) and CD38−/CD95+/GL‐7+ GC cells (percentages and absolute numbers, bottom panels) in WT (black) and IgD−/− (green) animals after 7 and 10 days postimmunization, mean ± SD (number of animals indicated in the top plot). Statistical significance was analyzed by a two‐tailed unpaired t‐test, n.s. = not significant.
